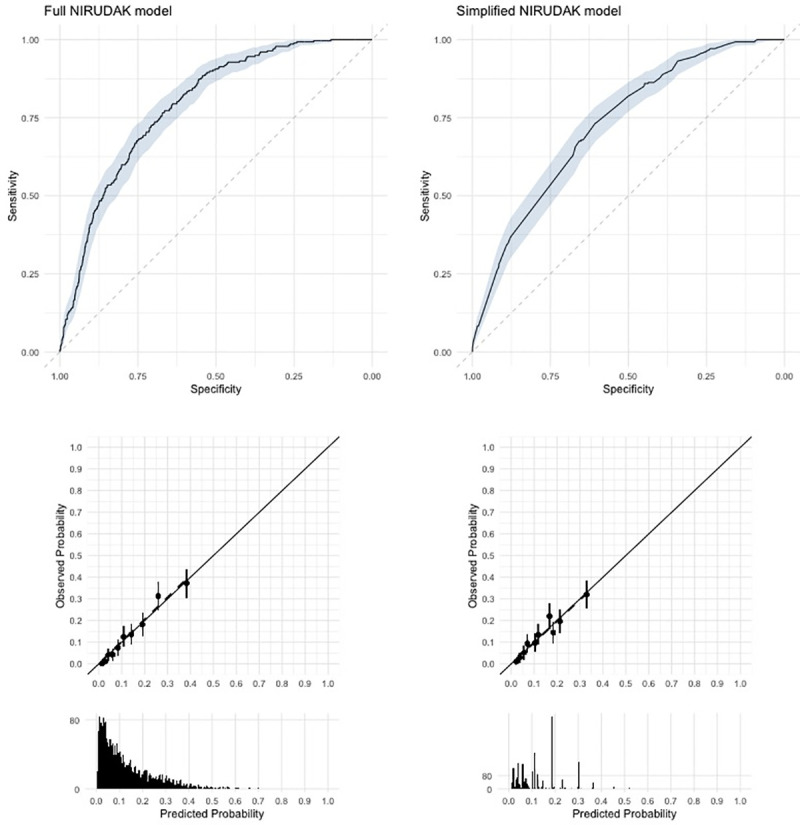
Fig 3. Discrimination and calibration for NIRUDAK models based on training data.

The top row shows Receiver Operating Characteristic Curves. Shaded area gives 95% confidence regions. The middle row plots observed versus predicted by deciles of predicted probabilities. The vertical lines give the 95% confidence intervals for the observed probability in each decile. The bottom row gives histograms of the predicted probabilities.
