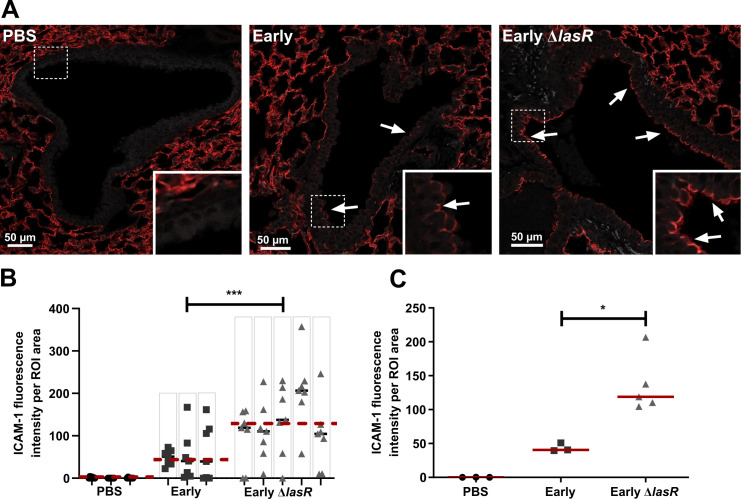
Fig 5. lasR mutant infected mice display increased airway epithelial ICAM-1 expression.
Mice were infected with Early, Early ΔlasR or PBS embedded agar beads and lungs were harvested at 2 days p.i. for ICAM-1 immunofluorescence (shown as red). (A) Images shown are representative of airway cross-sections displaying the median ICAM fluorescence scores of each infection group. Images were taken with a 20X objective, inset boxes are digital magnification of the bronchial epithelium and the white arrows point to regions of high ICAM-1 expression localized to the apical epithelial surface (luminal side). The green autofluorescence (Ex 488/ Em 518, shown as grey) was imaged to visualize the tissue structure. (B) ICAM-1 total fluorescence normalized to the airway surface area (ROI) in every image, with results shown as median within each lung (black line) and median within each group (—dashed line), each dot corresponding to one distinct airway, and columns corresponding to one distinct mouse lung. (C) Median normalized ICAM-1 fluorescence, with results shown as medians using data pooled from 7 randomly selected airways per lung, and each dot corresponding to one mouse (n ≥ 3 mice per condition). *P < 0.05; **P < 0.01; ***P < 0.001.

