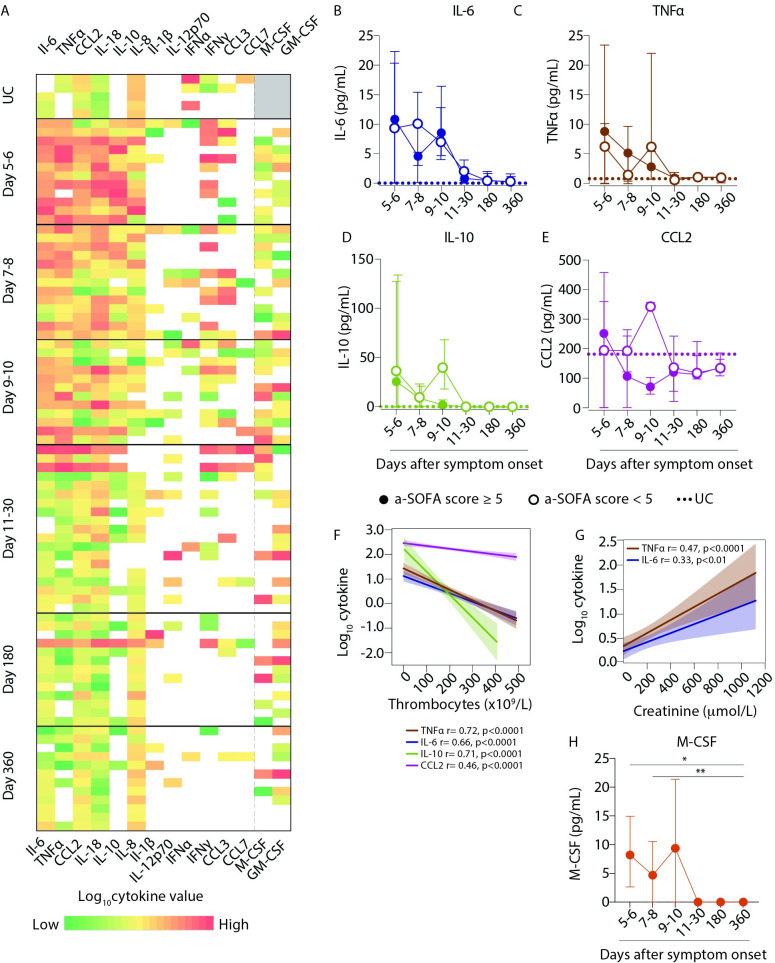
Fig 6. Plasma levels of pro-inflammatory cytokines are elevated during HFRS infection.
(A) Heatmap represents log10 cytokine concentrations (as assayed by Luminex and ELISAs) in plasma for UCs (n = 5) and HFRS patients (n = 21) over the course of acute PUUV infection and during convalescence. The color bar ranges from min (green) to max (red) within a column for each cytokine, yellow representing median values and white boxes representing no cytokine detection, and grey represents no samples assayed. (B-D) Graphs show median ± IQR plasma concentrations (pg/mL) of (B) IL-6, (C) TNFα, (D) IL-10 and (E) CCL2 in patients stratified by severity as lower, i.e. a-SOFA score <5 (empty circles) or higher, i.e. a-SOFA score ≥5 (filled circles). Median plasma cytokine concentration in UCs are indicated with dotted lines. (F-G) Lines display bivariate linear regression analysis between log10 cytokine values of (F) TNFα, IL-6, IL-10 and CCL-2 against thrombocyte counts (109/L). (G) Lines of fit display bivariate linear regression analysis between log10 cytokine values of TNFα and IL-6 against creatinine levels (μmol/L). The shaded area represents the 95% confidence region for the fitted line. r represents squared Spearman ρ and statistical differences were considered significant at p<0.05. UC = uninfected controls. (H) Graph shows median ± IQR plasma concentrations (pg/mL) of M-CSF over the course of HFRS in patients. Statistical differences between day 360 and other time points were assessed using a generalized estimated equation (GEE) model in SPSS and differences were considered significant at p<0.05 (*p<0.05 and **p<0.01).

