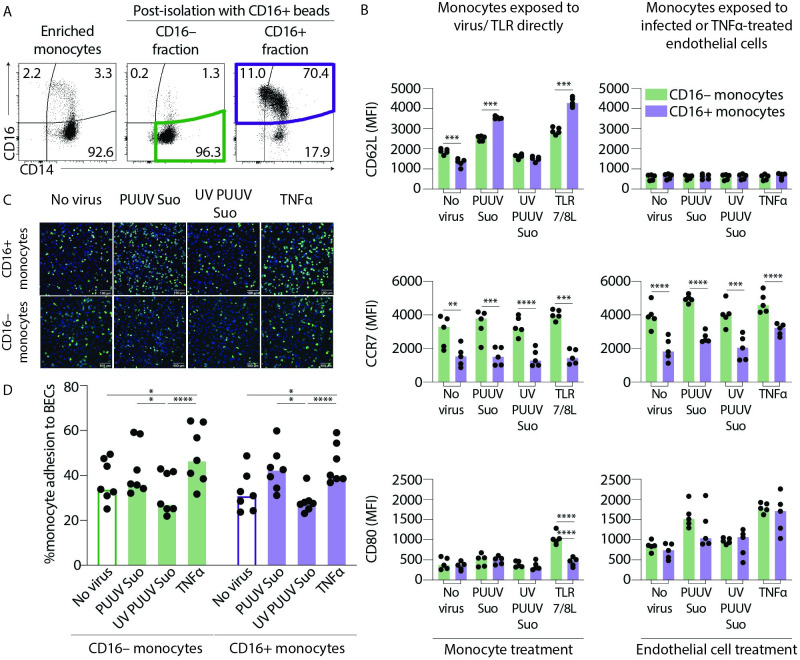
Fig 7. CD16+ and CD16– enriched monocytes respond differently during in vitro PUUV infection.
(A) Peripheral blood monocytes were first enriched by negative selection to remove B, T, NK cells and granulocytes using a RosetteSep enrichment kit. Plots show a representative sample of enriched monocytes before (pre-isolation) and after (post-isolation) isolation using magnetic CD16+ beads. Post-isolation graphs show CD16– fraction that is enriched in CD14+ CMs (green gate) and the CD16+ fraction that is enriched in CD16+ IMs and NCMs (violet gate). (B) Graphs show MFI of CD62L (top panels), CCR7 (middle panels) and CD80 (lower panels) expression on CD16– (green) or CD16+ (violet) monocytes exposed to PUUV (MOI = 1) directly for 1 h followed by 19 hr of incubation with fresh media (left panels) or PUUV-infected (MOI = 10, for 20 h) BECs (right panels); n = 5 from two independent experiments. Statistical differences between CD16+ and CD16– monocytes were assessed by two-way ANOVA with Tukey’s multiple comparisons test and considered significant at p< 0.05 (**p<0.01, *** p<0.001 and ***p<0.0001). (C) Representative images of HLA-DR staining of CD16+ (top panels) and CD16– (lower panels) monocytes adhered to endothelial cells (n = 7 donors). HLA-DR staining (green) defines monocytes and endothelial cell nuclei are counterstained with Hoechst 3342 (blue). (D) Graph summarizes % adherence of CD16+ (violet) or CD16– (green) monocyte adhesion to endothelial cells and lines connect data from same donors. Statistical differences were assessed by two-way ANOVA with Tukey’s multiple comparisons test and considered significant at p<0.05.

