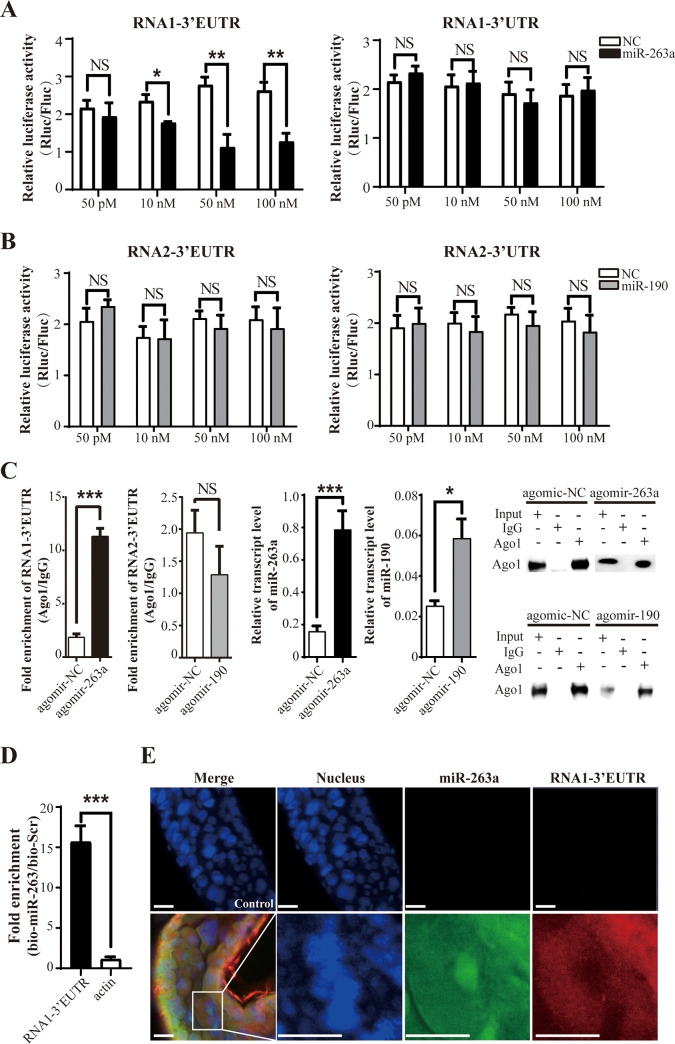
Fig 3. The extended 3’ UTR of viral RNA1 is targeted by planthopper miR-263a.
(A) Dual luciferase reporter assay in 293T cells cotransfected with miR-263a mimics and the recombinant pLightSwitch plasmid containing the 3’-untranslated terminal region (3’-UTR) or the extended 3’-UTR (3’-EUTR) of RSV RNA1 segment. (B) Dual luciferase reporter assay in 293T cells cotransfected with miR-190 mimics and the recombinant pLightSwitch plasmid containing the 3’-UTR or 3’-EUTR of RSV RNA2 segment. The mimic control (NC) was used in the control group instead of miR-263a or miR-190. The pGL4.13 plasmid expressing firefly luciferase (Fluc) was used as a reference control. The relative activity of Renilla luciferase (Rluc) encoded by the recombinant pLightSwitch normalized to Fluc is presented as the mean ± SE. (C) RIP analysis combined with real-time quantitative PCR (qPCR). An anti-Ago1 monoclonal antibody was used to pull down RNAs from viruliferous planthoppers injected with agomir-263a, agomir-190, or agomir control (agomir-NC). Mouse IgG was used as a negative control. The amount of 3’-EUTRs of RSV RNA1 or RNA2 in the Ago1 immunoprecipitates relative to that in the IgG samples (fold enrichment) was quantified using qPCR and compared in the groups treated with agomir-263a or agomir-190 injection and agomir-NC injection. miR-263a and miR-190 in the precipitates were assayed using qPCR. The level of Ago1 in the precipitates is shown in the western blot. NS, no significant differences. (D) Biotin pulldown assay coupled with qPCR was used to quantify the amount of 3’-EUTR of RNA1 in viruliferous planthoppers injected with biotinylated miR-263a (bio-miR-263a) or with control biotinylated scrambled sequences (bio-Scr). The transcript levels of actin were quantified and used as a negative control. From (A) to (D), the values are presented as the mean ± SE. NS, no significant differences. *, P < 0.05. **, P < 0.01. ***, P < 0.001. (E) Double fluorescence in situ hybridization (FISH) for miR-263a and the 3’-EUTR of RNA1 in the gut cells of viruliferous planthopper. Probes for Caenorhabditis elegans cel-miR-67-3p and rice PsbP gene were used in the control group. The probes for microRNAs were labeled with biotin. The probes for the 3’-EUTR of RNA1 and PsbP were labeled with digoxigenin. The nuclei were stained with Hoechst. Scale bars: 50 μm.

