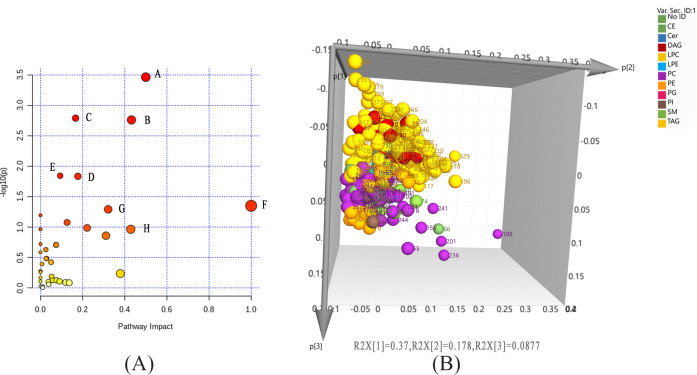
Fig 4.
Graphical representation of the pathway analysis of significantly altered metabolites in the three groups (A: metabolomic results; B: lipidomic results). A:D-glutamine and D-glutamate metabolism; B: glycine, serine and threonine metabolism; C: aminoacyl-tRNA biosynthesis; D: arginine metabolism; E: sphingolipid metabolism; F: linoleic acid metabolism; G: arginine and proline metabolism; H: taurine and hypotaurine metabolism. LPC: lysophosphatidylcholine; SM: sphingomyelin; TAG, triacylglycerol. Dark bule circle: cluster of LPC metabolites; red circle: cluster of SM metabolites; light blue circle: cluster of TAG metabolites.

