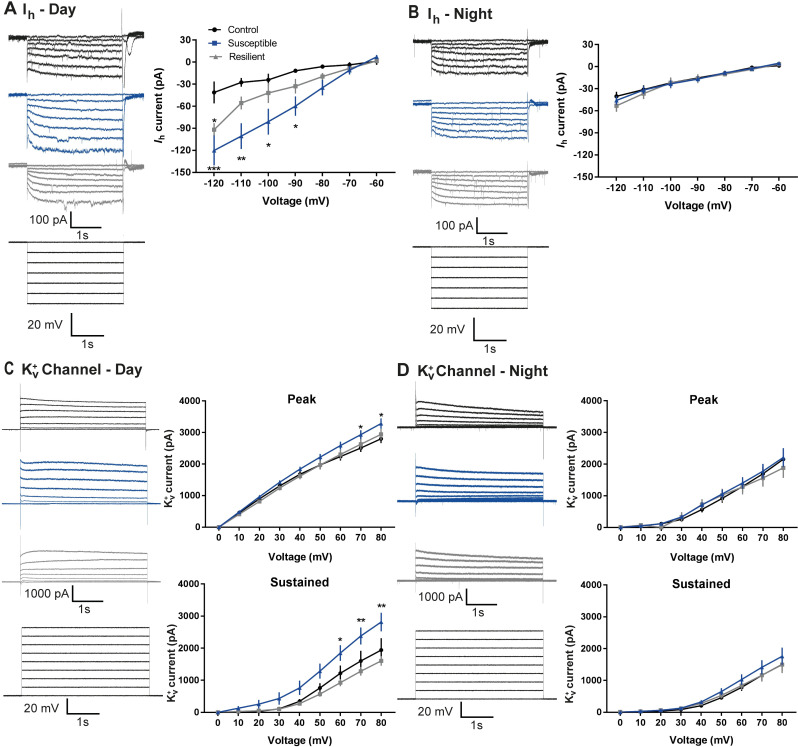
Fig 3. Diurnal rhythms in Ih and Kv+- currrents in cellsLHb→DRN of susceptible mice.
(A) Daytime representative traces (left) and statistical data of Ih-currents in response to incremental steps in voltage injections (right). Resilient and susceptible mice display significant increase in Ih-current compared to control (F2,252 = 23.29, P < 0.0001; n = 10 to 14 cells from 7 to11 mice per group). (B) Nighttime representative traces (left) and statistical data of Ih-currents in response to incremental steps in voltage injections (right). There was no difference in current between any of the phenotypes. (C) Daytime representative traces (left) and statistical data of isolated Kv+ channel–mediated currents (right). Susceptible mice display significant increase in peak (F2,216 = 9.94, P < 0.0001; n = 6 to 11 cells from 7 to 8 mice per group; top) and sustained (F2,216 = 24.97, P < 0.0001; n = 6 to 11 cells from 7 to 8 mice per group; bottom) phases of Kv+-currents. (D) Nighttime representative traces (left) and statistical data of isolated Kv+ channel–mediated currents (right). There is no difference in peak and sustained phases of Kv+-currents among the 3 phenotypes. Error bars: mean ± SEM. The raw data can be found in S3 Data.

