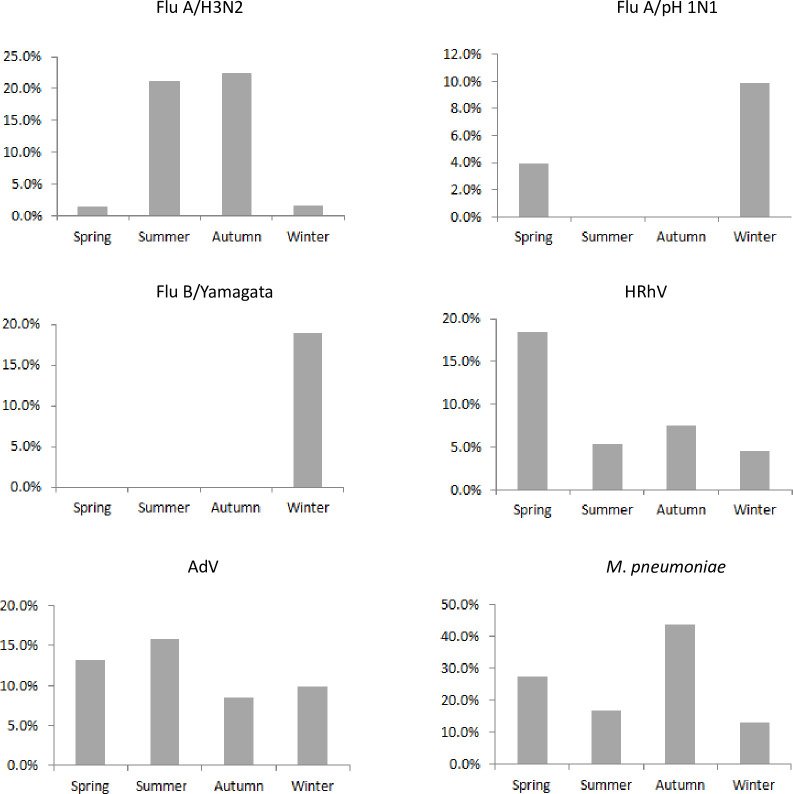
Fig 2. Detection rates of the six main pathogens in adult SARI patients in different seasons in a surveillance hospital in Jinshan, Shanghai.
Each panel shows the seasonal distribution of a pathogen in SARI patients. For each pathogen, the detection rate on the y-axis refers to the number of positive patients divided by the total number of patients tested in a season.

