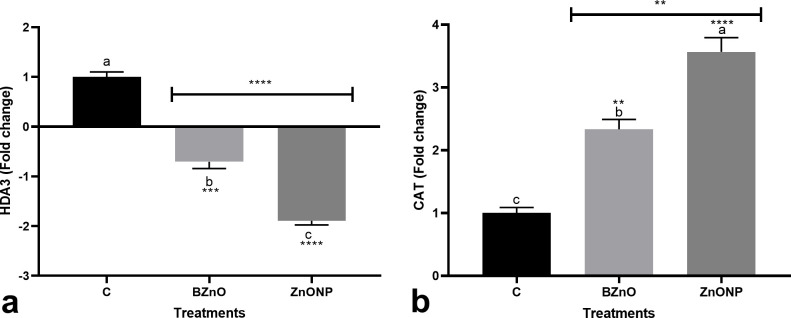
Fig 3.
The variation in the expression of HDA3 [a] and CAT [b] in response to the long-time foliar application of BZnO and ZnO-NP; Different letters on top of columns refer to statistically significant differences according to Tukey’s multiple comparisons test. ns: non-significant; *: 0.01<p≤0.05; **: 0.001<p≤0.01; ***: 0.0001<p≤0.001; ****: p≤0.0001. The p-value levels for comparing the mean of each group vs the control group are displayed by the asterisk on each column. Also, an asterisk [*] on the drawn lines presents the p-value levels for comparison between the BZnO and ZnONP groups.

