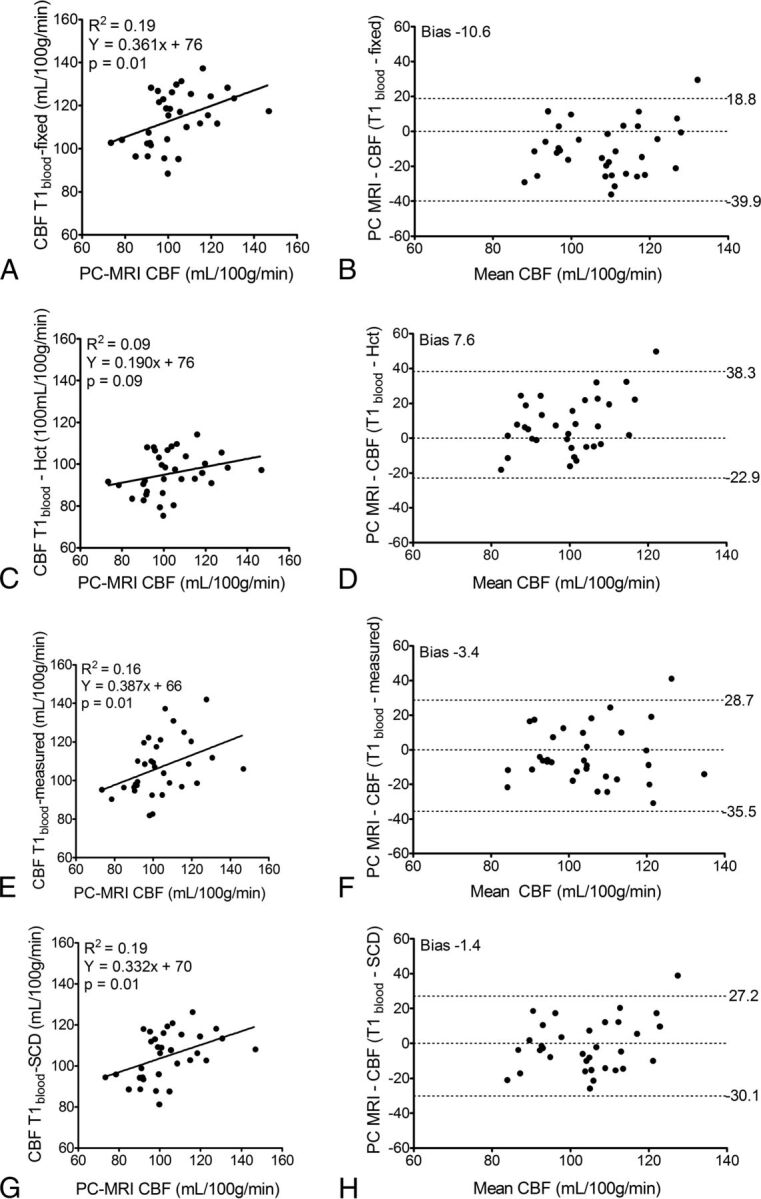
Fig 2.

Linear regression and Bland-Altman plots between CBF values measured with PC-MRI and ASL, which was quantified by using 4 different T1blood values: a fixed literature value of 1650 ms (CBF T1blood-fixed) (A and B); T1blood calculated from hematocrit (CBF T1blood-Hct), T1 = 0.5*Hct+0.37 (C and D)16; in vivo–measured T1blood (CBF T1blood-measured) (E and F); and a fixed SCD value obtained from the mean of the in vivo–measured T1blood (CBF T1blood-SCD) (G and H). The left panel shows linear regressions (solid line), and the right panel shows the mean on the x-axis versus the difference on the y-axis between pCASL and PC-MRI CBF with limits of agreement (dotted lines above and below) (n = 33).
