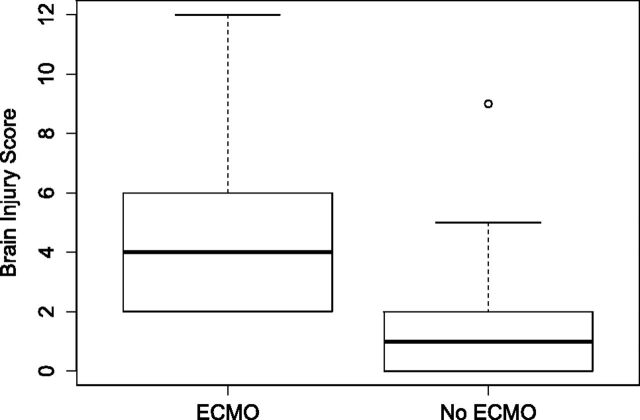
Fig 3.
Boxplots of the distribution of the brain injury score in infants with CDH with ECMO and those without it. The central thick line in each box is the median score. The limits of the box indicate upper and lower quartiles. The whisker limits indicate the highest or lowest score, not considering outliers. There is 1 outlier with a higher brain injury score in the non-ECMO group with a score of >1.5 interquartile range above the upper quartile. This infant had a CDH defect D.

