Fig. 1.

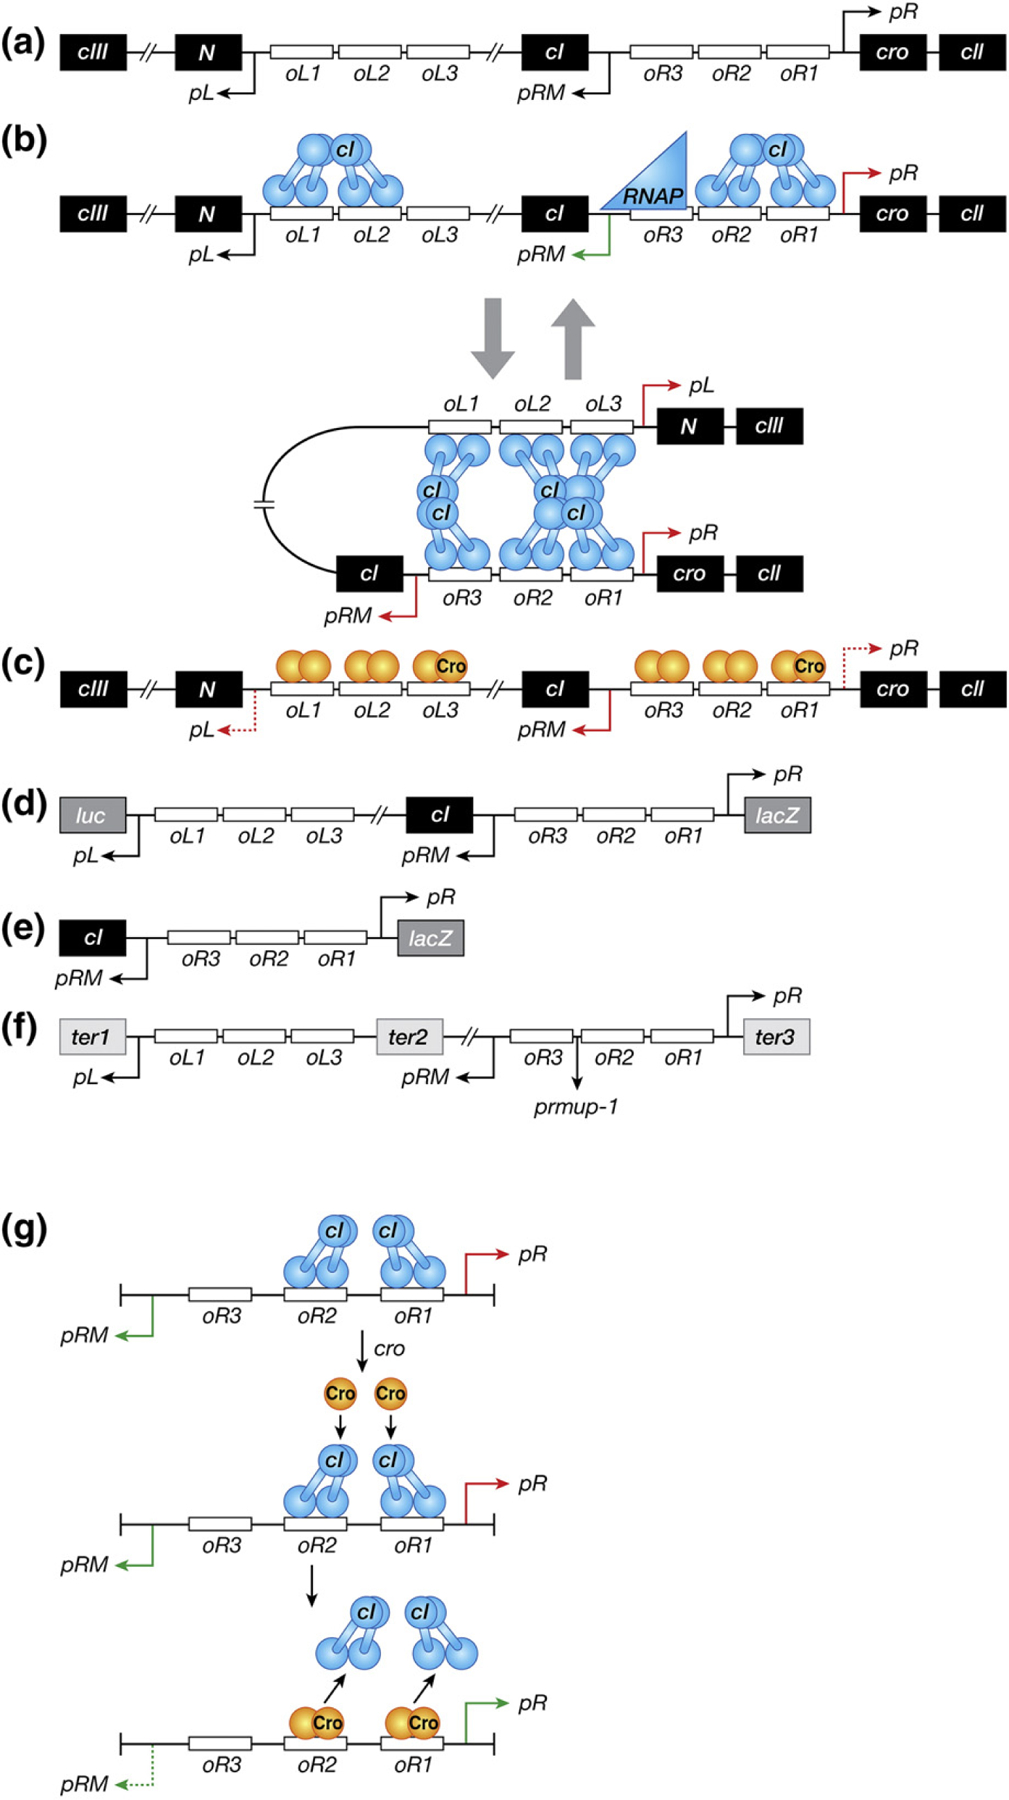
(a) Schematic representation of the regulatory region of bacteriophage λ that controls the switch from the lysogenic to lytic growth. Genes and operators are marked in black and white boxes, respectively. Promoters are represented as arrows whose direction corresponds to the direction of the transcription initiation from the promoters. The relevant genes and sites are discussed in the text. (b) DNA–CI interactions in the lysogenic state. CI molecules and RNA polymerase are shown as blue dumbbell shapes and triangle, respectively. Green arrows associated with promoters symbolize positive transcription, whereas red arrows signify repression. All the other symbols are the same as in panel A. (c) DNA–Cro interactions in the lytic state. Cro molecules bound to high-affinity operators (oR3 and oL3) are shown as dark orange ovals, whereas those in the low-affinity operators (the other oR and oL operators) are signified as light orange ovals. Red dashed arrows represent partial repression of corresponding promoters. All the other symbols are the same as in panel B. (d) A double-reporter system of λ prophage for measuring activities of pR and pL fused to lacZ and luc genes, respectively. (e) A reporter system to assay the activity of pR fused to lacZ in the absence of DNA looping. (f) The plasmid DNA template (pDL985) used for in vitro transcription assays [37]. Transcriptions from pL, pRM and pR stop at engineered terminators marked with black boxes, ter1 (timm of λ), ter2 (t1 t2 of rrnB operon), and ter3 (trpoC of rpo operon), respectively. The prmup-1 mutation is shown between oR2 and oR3. Genes located between oL3 and oR3 (cI, rexA, and rexB) are partially or completely deleted, resulting in the distance of 392 bp between oL3 and oR3 in this plasmid DNA [37]. All the other symbols are the same as in panel A. (g) Model of the de-repression of pR by Cro in the presence of CI. The details of the model depicted here are described in Discussion. All the symbols are the same as in panels B and C.
