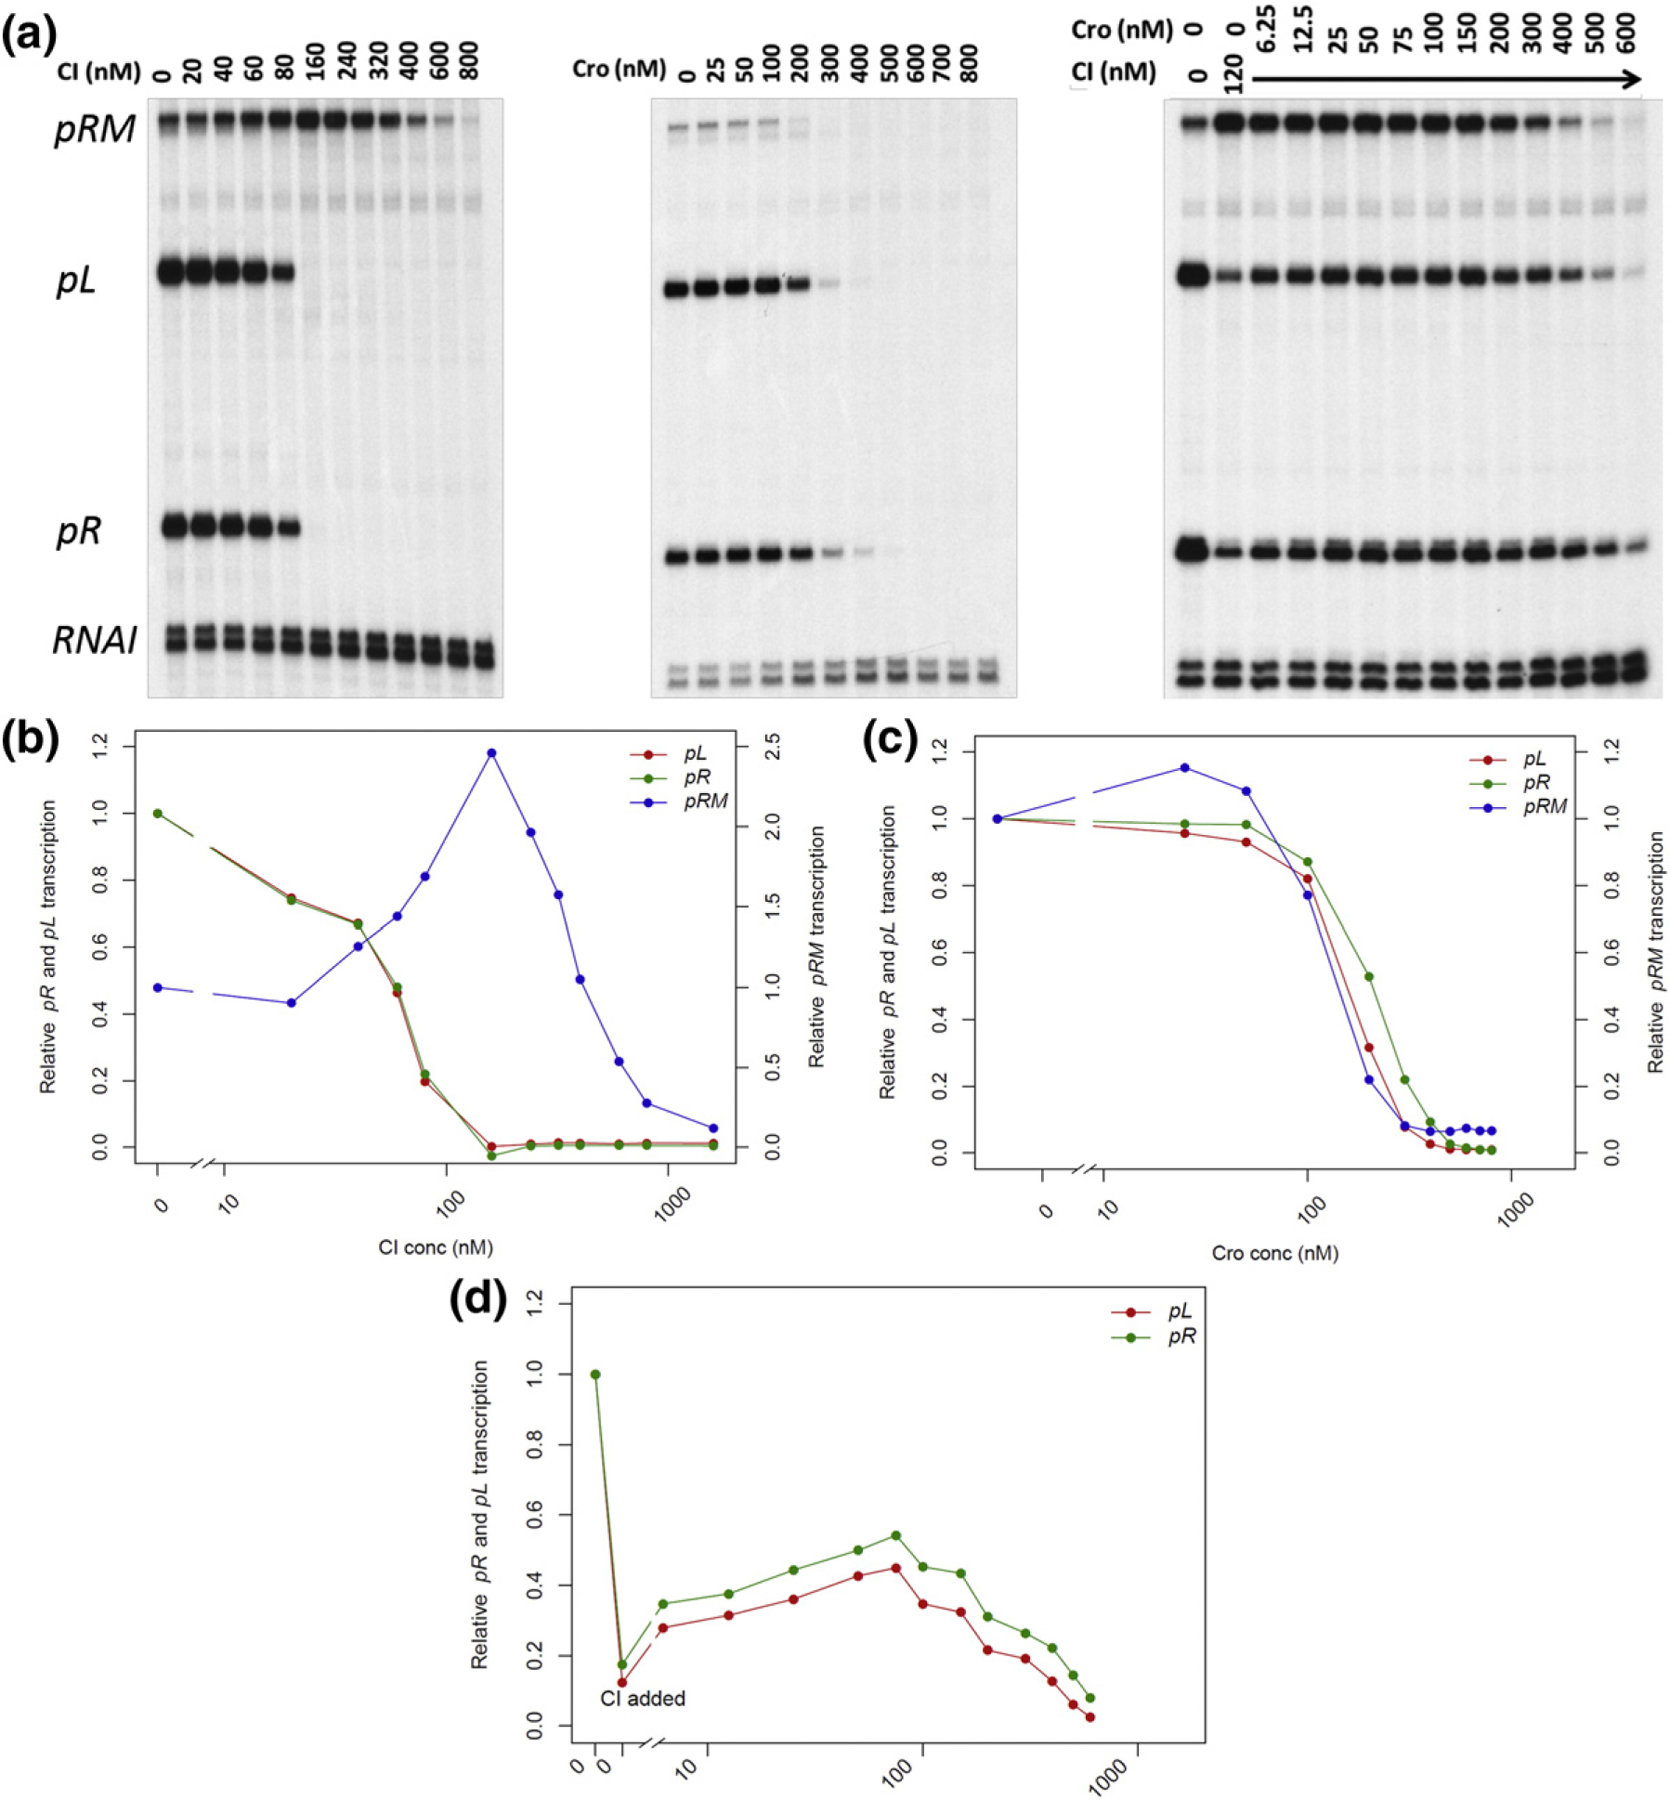
Fig. 4.

In vitro transcription assay results. All transcription assays were repeated 2–4 times with similar results. (a) Results of a typical in vitro transcription assay. The transcripts are identified in left margin. (b–d) Quantification of the representative in vitro transcription assays in panel A. The right y-axis represents the relative pR and pL transcription levels against no-protein control, whereas the left y-axis shows that of pRM. The x-axis is shown in log scale. CI titration (B), Cro titration (C), and in vitro transcription assay (D) with increasing amounts of Cro and a fixed amount of CI (120 nM).
