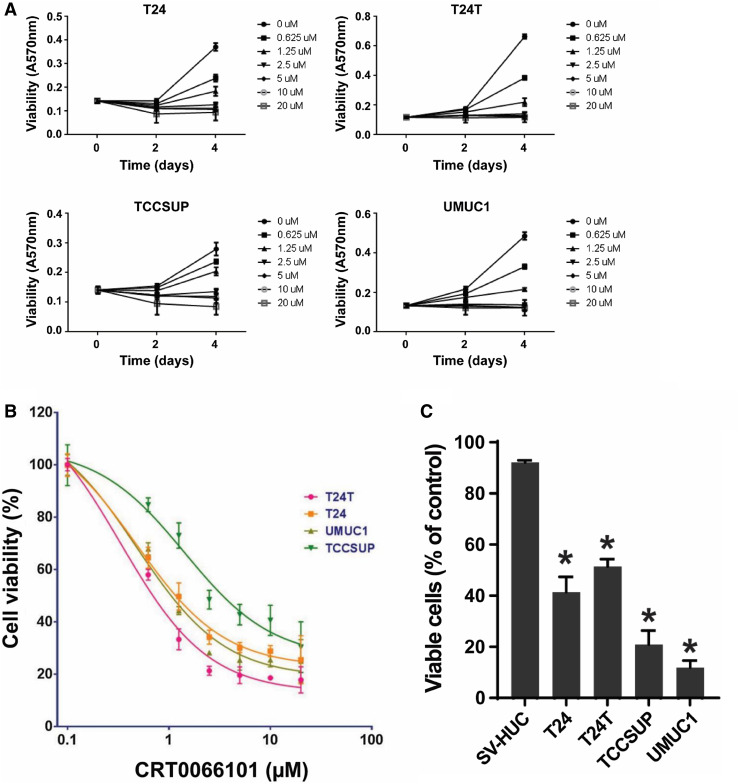
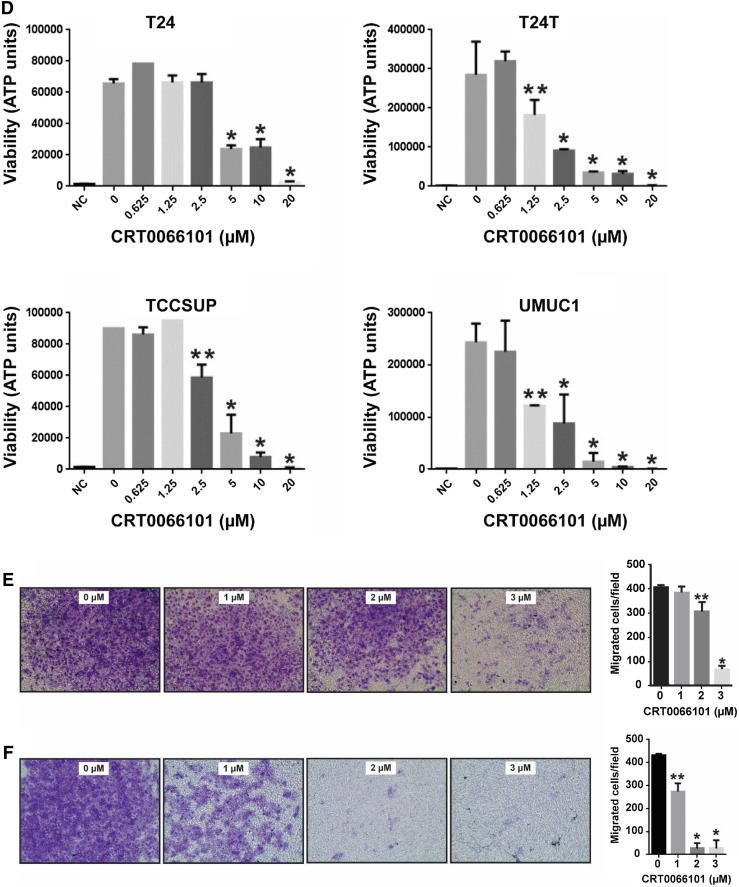
Fig. 2.
CRT0066101 suppresses proliferation, anchorage-independent growth, and migration of bladder carcinoma cells in vitro. a, b Bladder cancer cells (T24, T24T, TCCSUP, and UMUC1) were treated with CRT0066101 at the indicated concentrations. Cell viability was determined at days 0, 2, and 4 by the MTT assay (a). Dose–response effect of CRT0066101 at 4-day treatment (b). Cell viability values are expressed relative to those for cells with no drug exposure. The IC50 values for CRT0066101 at day 4 in the four cell lines were calculated using GraphPad Prism version 6.01 software. c Differential effect of CRT0066101 on cell survival between human uroepithelial cells and bladder tumor cells as determined by using a Celigo image cytometer. The four bladder cancer cell lines and the human uroepithelial cell line SV-HUC were incubated with CRT0066101 at 5 µM for 6 days. Cell viability was simultaneously stained with a mixture of calcein AM, propidium iodide, and Hoechst 33342 reagents for respective staining of live, dead, and all cells, and the percentage of viable cells was quantified with the Celigo imaging cytometer. *P < 0.01 versus SV-HUC cells. d CRT0066101 abrogates bladder carcinoma cell growth in low attachment (GILA). The four bladder cancer cell lines were distributed in a 96-well flat bottom ultra-low attachment microplate and treated with CRT0066101 at the indicated concentrations. After 5 days of incubation, cell viability was measured as described in “Materials and methods”. NC no cells. *P < 0.01 and **P < 0.05 vs. the untreated control group. e, f CRT0066101 reduces the invasive ability of bladder cancer cells. A two-chamber cell invasion assay was used for assessing the effect of CRT0066101 on the invasion capability of bladder carcinoma cells. TCCSUP cells (e) and UMUC1 cells (f) were treated with CRT0066101 at the indicated concentrations, and cell migration/invasion was then assessed after 2 days of incubation at 37 °C in the chamber, as described in “Materials and methods”. The numeric data for the two cell lines are shown in the two column graphs, respectively. *P < 0.01 and **P < 0.05 vs. the untreated control group


