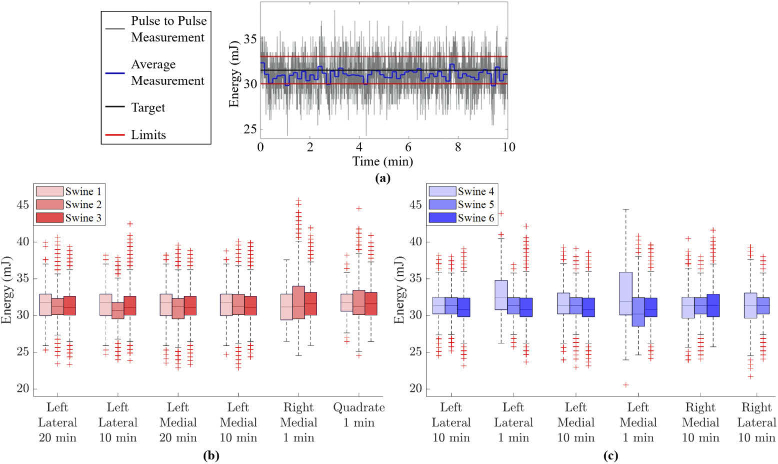
Fig. 3.
(a) Example of laser energy fluctuation during a 10-minute laser application for Swine 1, showing the pulse-to-pulse measurements, the sliding-average over 50 pulses, the mean energy, and the allowable tolerance on the mean energy. Summary of energies applied to each laser site within (b) non-survival, and (c) survival swine. Note that Swine 6 did not have an accessible right lateral lobe.

