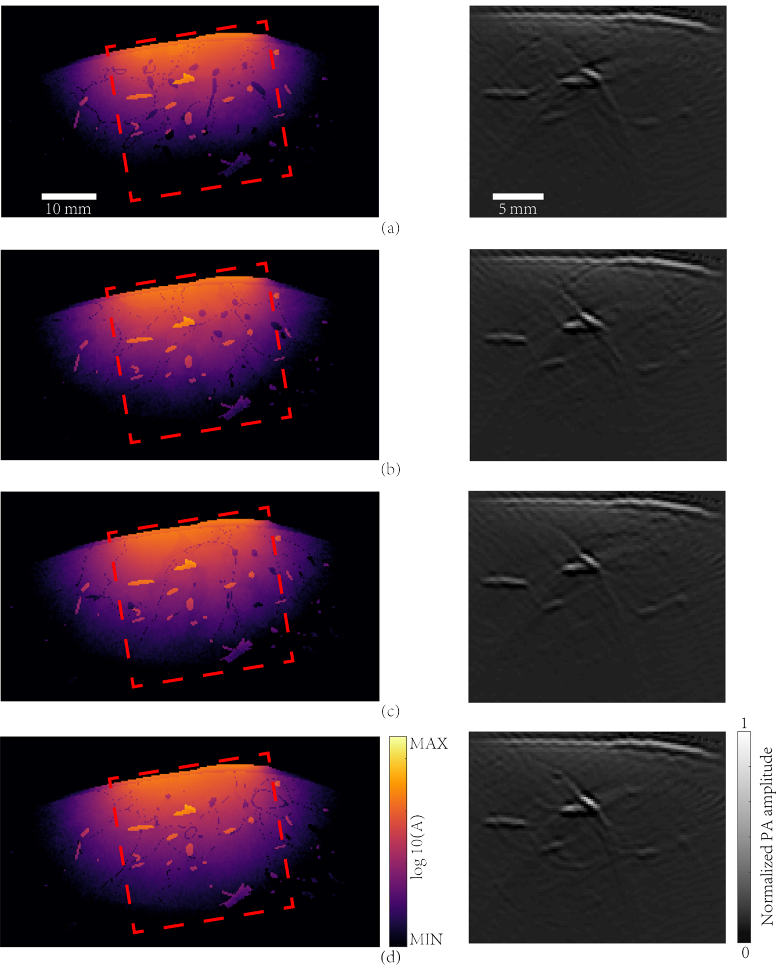
Fig. 6.
Simulation results for different types of breasts. Column on the left are images of light energy deposition at a wavelength of 900 nm. Column on the right are images of PA initial pressure reconstructed with a uniform speed of sound of 1500 m/s. (a) Extremely dense breast; (b) Heterogeneously dense breast; (c) Breast with scattered fibroglandular; (d) Breast with almost entirely fat. Red dashed boxes represent the region shown in the PA images.

