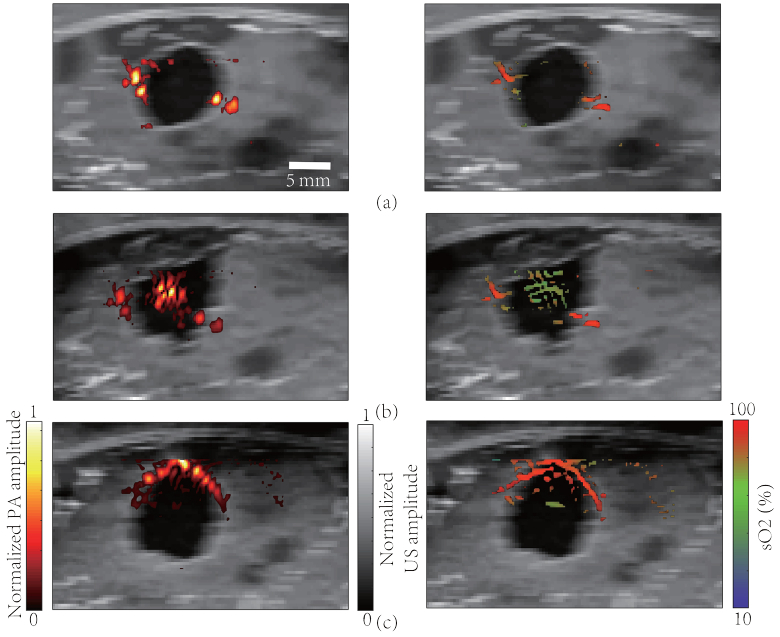
Fig. 7.
Simulation results of PA/US dual-modality breast imaging. Left column: tHb images superimposed on grayscale ultrasound images. The color scheme for PA signal is shown on the bottom left. Right column: sO2 images superimposed on grayscale ultrasound images. The color scheme for sO2 display is shown on the bottom right. (a) Fibroadenoma; (b) DCIS; (c) IBC.

