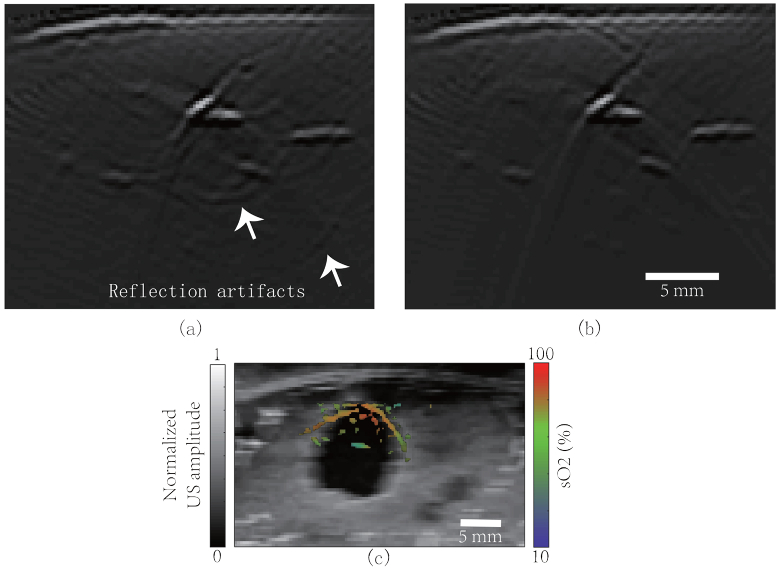
Fig. 8.
Using the model to study reflection artifacts and spectral coloring effect. (a) PA image of the breast (acoustically heterogeneous medium); (b) PA image of the breast (acoustically homogeneous medium);(c) PA + US imaging of an IBC mass. Color: sO2 map from multispectral PAI; grayscale: US image. sO2 estimation is different from Fig. 7(c) because no fluence compensation was performed.

