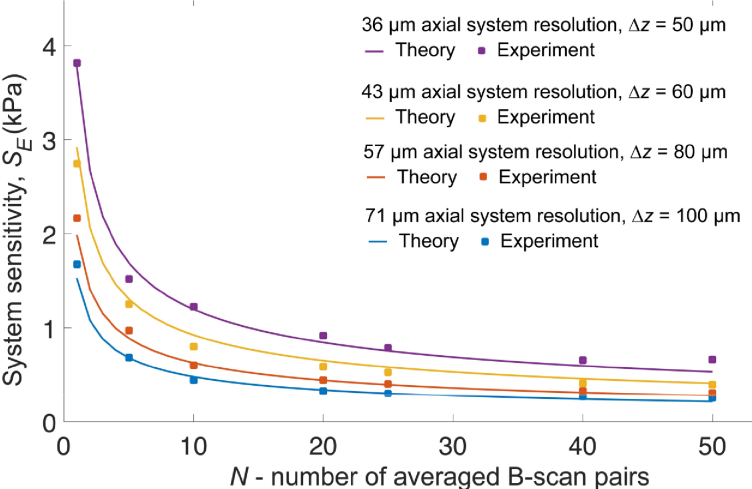
Fig. 2.
Comparison between the theoretical (Eq. (17)) and experimental QME system sensitivity as a function of temporal averaging at axial system resolutions of 36 µm (purple), 43 µm (yellow), 57 µm (orange), and 71 µm (blue). The theoretical measurements are denoted by solid lines and the experimental measurements are denoted by solid squares.

