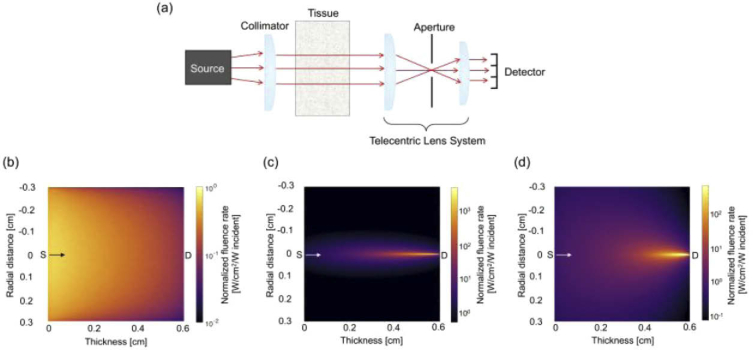
Fig. 1.
(a) Simplified angular domain optical projection tomography system. (b-d) Monte Carlo-generated normalized fluence rate maps plotted as a function of tissue thickness (z-axis, parallel to direction of illumination) and tissue radial distance (x-axis, perpendicular to the direction of illumination). (b) Source sensitivity profile. Representative (c) detector sensitivity profile and (d) source-detector pair sensitivity profile for a detector element located at x = 0 cm and y = 0 cm. Light is presented as traveling in the direction of the arrows – from left (source side, S) to right (detector side, D).

