
Figure 1. FNR is not detected in the chloroplast stroma of higher plants.
(A) Representative micrograph showing immunogold labelling of FNR in sections of chloroplasts from Wt Arabidopsis detected by IGL-TEM. White arrows indicate example gold particles. (B) Immunogold labelling density of FNR in different sub-chloroplast compartments, n = 15–22 chloroplasts each from three Wt individuals (grey) and 3 fnr1 (white) individuals. Outliers shown. See Figure 1—figure supplement 1 for quality control of antibodies and Figure 1—figure supplement 2 for optimisation of IG-TEM technique. See Table 1 for statistical significance in a mixed effects model analysis of variance between genotypes and between sub-compartments within each genotype.

Figure 1—figure supplement 1. Specificity of antisera used for Immunogold labelling and blue native PAGE western blots.
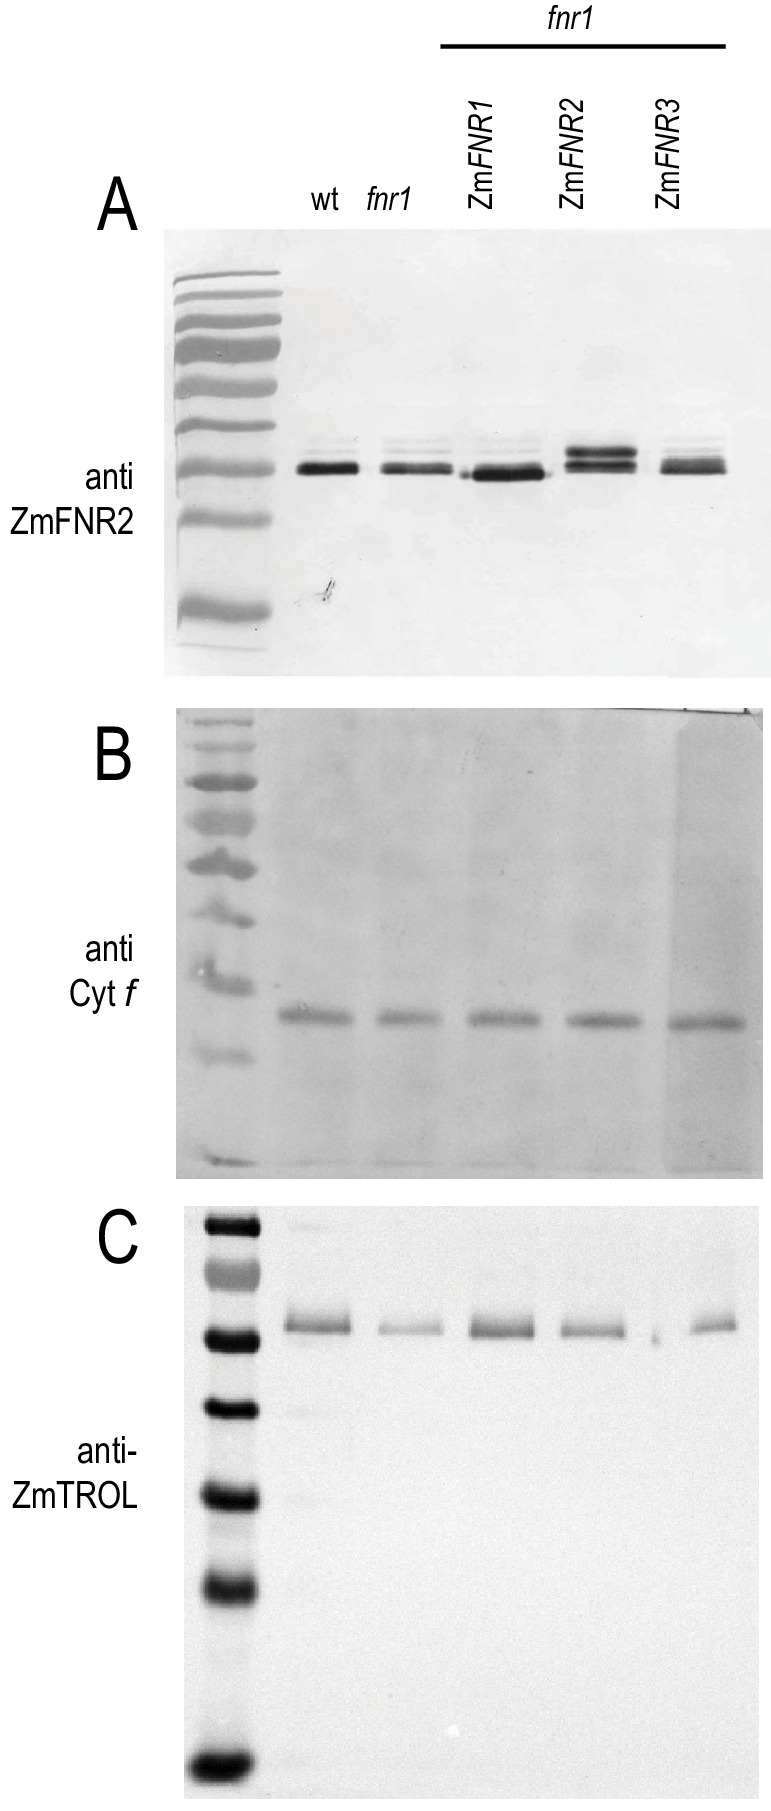
Mature Arabidopsis leaf protein extract was subjected to SDS-PAGE before immunoblotting and detection of (A) FNR, (B) cytochrome f (Cyt f), and (C) TROL. The gel was loaded with 20 µg protein for each sample, blotted, challenged with the indicated antisera, and visualised using alkaline phosphatase conjugated secondary antibody.
Figure 1—figure supplement 2. Detecting protein localisation in sub-chloroplast compartments.

(A) Representative micrograph of a wt chloroplast, with acceptable uranyl acetate staining for detection of sub-chloroplast localisation of proteins. Chloroplast was immunolabelled to detect FNR. (B) The same micrograph with sub-chloroplast regions defined. Within the yellow border, identifiable stromal region, Green, grana core; Blue, stromal lamellae not connected to appressed membrane, defined as a ~ 10 nm area with the membrane in the centre; Cyan, margin, defined as ~10 nm region around membranes exposed to the stroma, but adjacent to an appressed membrane. (C) Signal density of FNR immunogold label in chloroplasts of a single wt individual with margins and lamellae combined (n = 22). Colours code as for panel (B). Outliers shown. Supplementary file 2a for statistical analysis in a mixed effects model of variance between sub-compartments. (D) As for (C), except IGL for cytochrome f. Signal density of cytochrome f immunogold label in chloroplast areas defined as for FNR analysis. Supplementary file 2b for statistical analysis in a mixed effects model of variance between sub-compartments.