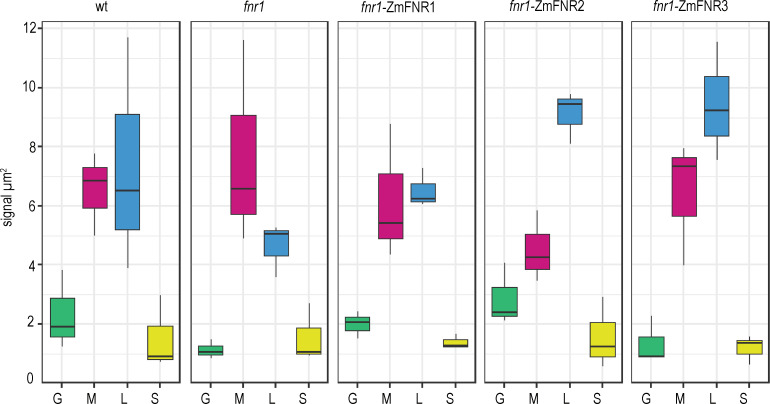
Figure 3. Tether interactions determine FNR sub-chloroplast location.
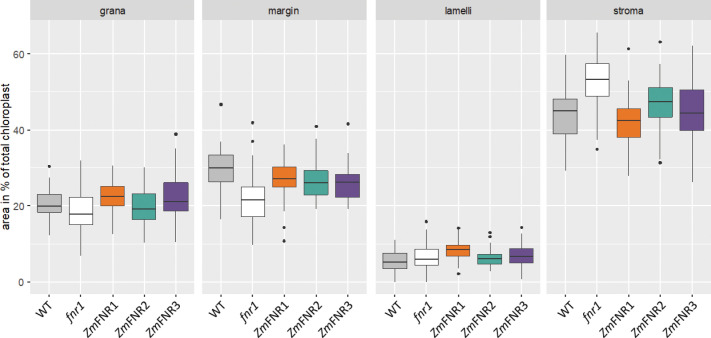
Density of immunogold labelled FNR in different sub-chloroplast compartments of the indicated genotypes. Values are averages of three biological replicates, with combined label and area for the sub-compartments of 15–20 chloroplasts for each individual. Areas shown are: grana core (green), margins (magenta), stromal lamellae (blue), and stroma (yellow). See Figure 3—figure supplement 1 for confirmation that sub-chloroplast areas do not vary between genotypes. Statistical significance between sub-compartment signal density within genotypes was calculated with a mixed effects model analysis of variance (Table 2).


