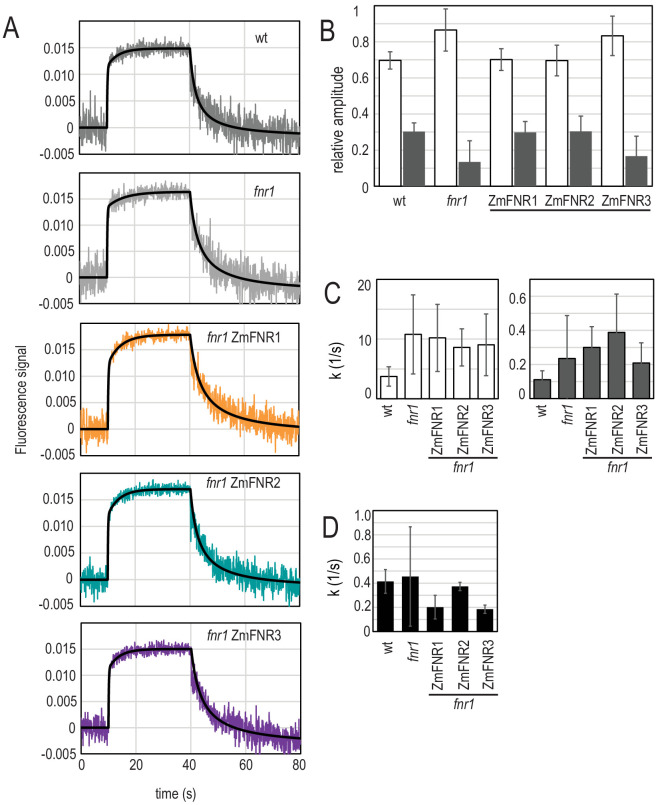
Figure 4. Light-dependent NADP(H) reduction and oxidation kinetics are influenced by FNR location and binding partners.
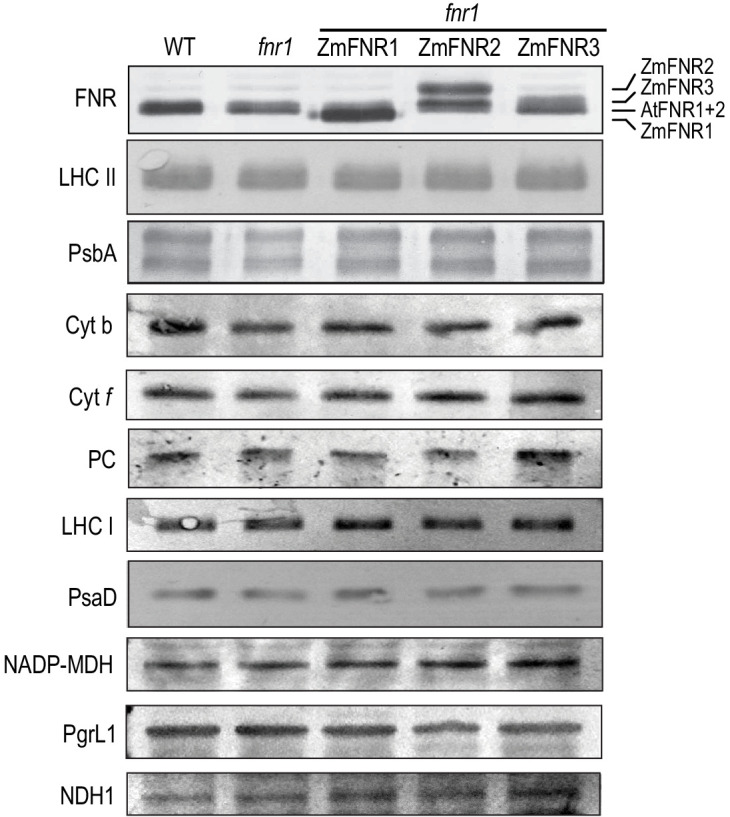
(A) Traces show NADPH fluorescence of dark adapted Arabidopsis chloroplasts measured over a short light exposure from 10 to 40 s. Traces are averages of three to five independent chloroplast preparations, each of which was composed of an average of 15 separate measurements. Genotypes from which chloroplasts were isolated are indicated on each graph. Black traces overlaying signals are fits (two components for reduction, one component for oxidation), calculated as described in Materials and methods. (B) Relative amplitude of fast (white bars) and slow (grey bars) components fitted to the NADP+ reduction traces shown in (A). (C) Rate of fluorescence induction for the fast (white bars, left) and slow (grey bars, right) components fitted to the NADP+ reduction traces shown in (A). (D) Rate of NADPH fluorescence decay following switching off the light, fitted to the traces shown in A. B–D are averages of values calculated from three to five separate chloroplast preparations (parameters in Supplementary file 2c and e). All values given ± standard error (fitting errors with absolute, 95% confidence). See Figure 4—figure supplement 1 for comparison between genotypes of proteins involved in NADP(H) metabolism. Appendix 1 describes further characterisation of the two phases of NADP+ reduction and Appendix 1—figure 1 shows further data on this topic.
Figure 4—figure supplement 1. Abundance of the major photosynthetic complexes in the genotypes used in this study.


