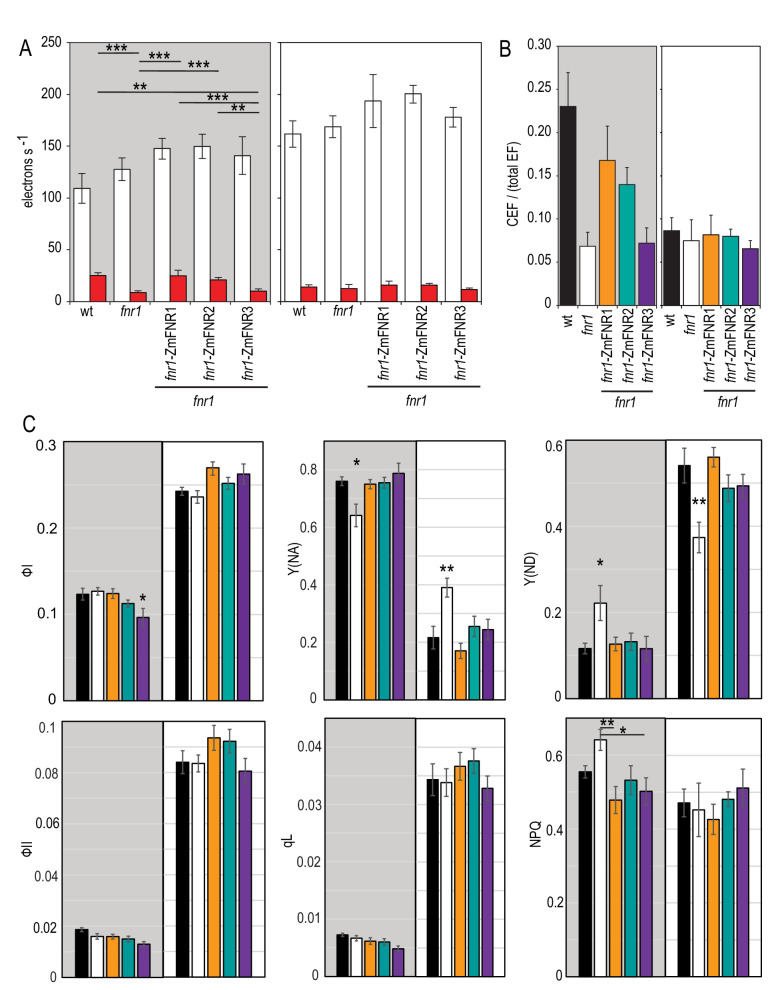
Figure 5. Impact of FNR location on photosynthetic electron transport in Arabidopsis following dark adaptation or light acclimation.
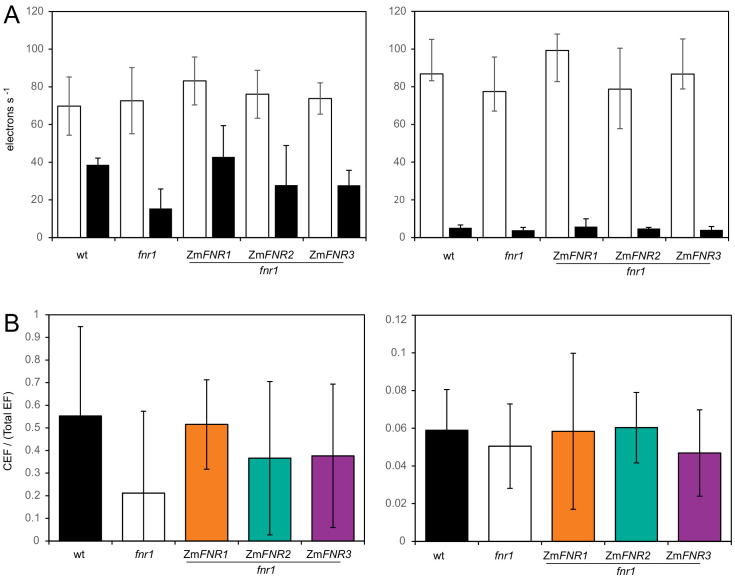
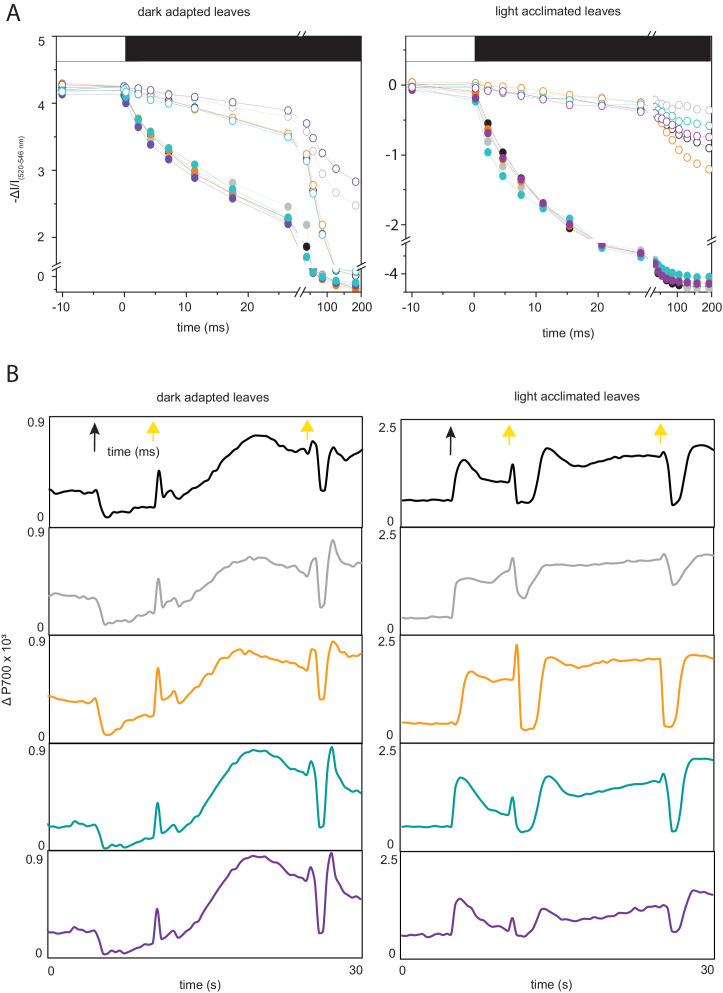
(A) ECS measurements after a 20 s high light pulse on dark adapted leaves (grey background) and light acclimated leaves (5 min 150 µE m−2 s−1, actinic light). The relaxation kinetics of ECS were measured at 520–546 nm after a 20 s pulse of actinic light at 1100 µmol photons m−2 s−1 (LEF + CEF stimulating, white boxes) or far red light (CEF stimulating, red boxes). Averages are shown for between five and seven independent measurements ± s.d. (B) Relative amount of CEF as a function of total electron flow calculated from the data in (A). Figure 5—figure supplement 1 shows a comparable experiment preformed with DCMU rather than far red light to drive PSI activity. (C) The response to high light in dark adapted leaves (grey background) and light acclimated leaves (5 min 150 µE m−2 s−1, actinic light, white background) was measured by detecting chlorophyll fluorescence and P700 oxidation with saturating pulses following 20 s of actinic light at 1100 µmol photons m−2 s−1. Measurements are averages ± s.e. of 6–12 replicates of the following genotypes: black, wt; white, fnr1; orange, fnr1-ZmFNR1; cyan, fnr1-ZmFNR2; purple, fnr1-ZmFNR3. Photosystem I parameters (quantum efficiency, ФI; donor limitation, Y(ND); acceptor limitation, Y(NA)) and photosystem II parameters (quantum efficiency, ФII; non-photochemical quenching, NPQ; photochemical quenching, qL). p-value significance in Tukey post hoc analysis of ANOVA is indicated as 0 ‘***’, 0.001 ‘**’ 0.01 ‘*’ 0.05 ‘.’. Unless indicated by bars, stars indicate variation from all other genotypes. Representative P700 and ECS traces are shown in Figure 5—figure supplement 2.


