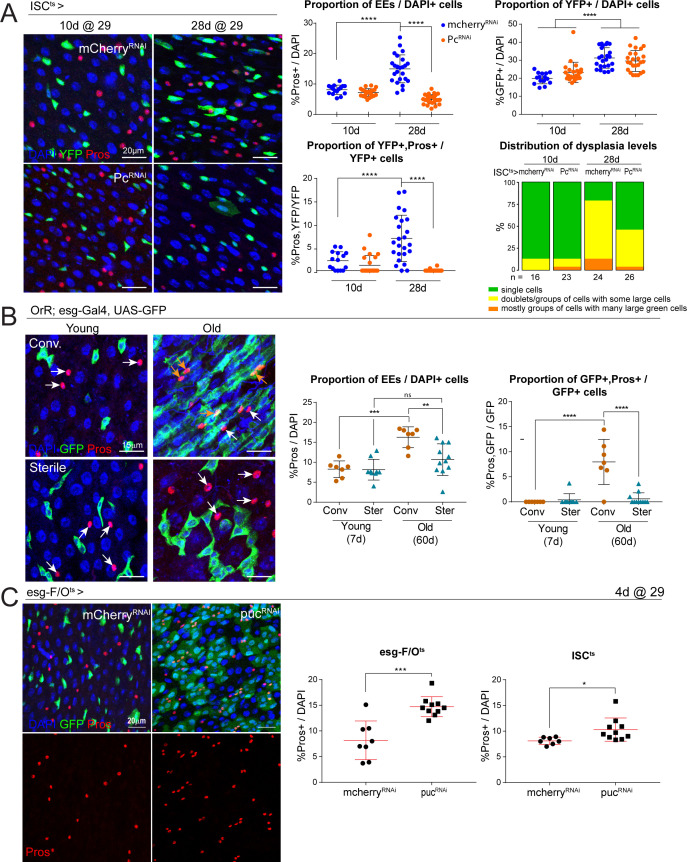
Figure 6. Long-term downregulation of Polycomb levels inhibits EE increase, which is elevated after stress signaling.
(A) Midguts from flies aged at 29°C for short- (10d) and long-term (28d) knockdown of Pc specifically in ISCs using the ISCts fly line. Immunostaining shows ISCs (YFP+, green), EEs (Pros+, red) and DAPI (blue). The proportion of EE cell numbers of total DAPI cells per view, as well as the proportion of EE progenitors of total ISCs per view, are quantified on the right. One-way ANOVA followed by Tukey’s multiple comparisons test: ****, p<0.0001. Distribution of dysplasia levels across short- and long-term knockdown of Pc in ISCs compared to control cherry knockdown. mcherry-RNAi (10d): n = 16; Pc-RNAi (10d): n = 23; mcherry-RNAi (28d): n = 24; Pc-RNAi (28d): n = 26; N = 1. (B) Comparison of the number of EEs in conventionally versus axenically (sterile) raised flies. Staining shows ISCs/EBs marked by GFP (green), EEs marked by Pros (red) and DAPI (blue). The proportion of EEs in total DAPI cells is quantified on the right as well as the proportion of EE progenitors in the total ISC population. Levels of dysplasia correlated with numbers of EE progenitors regardless of age (Figure 6—figure supplement 1). One-way ANOVA followed by Tukey’s multiple comparisons test: **, p=0.0033; ***, p=0.0002; ****, p<0.0001. Young, conv.: n = 7; young, sterile: n = 9; old, conv.: n = 7; old, sterile: n = 11; N = 1. (C) Immunostaining of posterior midguts after overexpression of mcherry-RNAi or puc-RNAi for 4 days using esg-F/Ots. Quantification of EE cells as a proportion of total DAPI cells per view using esg-F/Ots or ISCts to drive expression is shown on the right. Two-tailed t-test: *, p=0.0268; ***, p=0.0002. esg-F/Ots>mcherry-RNAi: n = 8; puc-RNAi: n = 10; N = 2. ISCts>mcherry-RNAi: n = 7; puc-RNAi: n = 10; N = 1. n: number of posterior midguts analyzed; N: number of independent experiments performed with similar results and a similar n. Data represented as mean ± SD.


