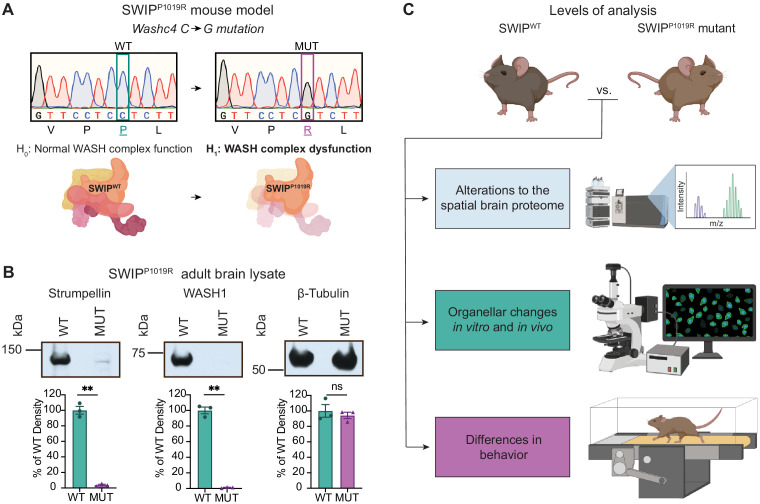
Figure 2. Mouse model of the human SWIPP1019R mutation displays decreases in WASH complex components.
(A) Mouse model of the human SWIPP1019R missense mutation created using CRISPR. A C>G point mutation was introduced into exon29 of murine Washc4, leading to a P1019R amino acid substitution. We hypothesize (H1) that this mutation causes instability of the WASH complex. (B) Representative western blot and quantification of WASH components, Strumpellin and WASH1 (predicted sizes in kDa: 134 and 72, respectively), as well as loading control β-tubulin (55 kDa) from adult whole-brain lysate prepared from SWIP WT (Washc4C/C) and SWIP homozygous MUT (Washc4G/G) mice. Bar plots show quantification of band intensities normalized to β-tubulin, expressed as a % of WT (n=3 mice per genotype). Strumpellin (WT 100.0±5.1%, MUT 3.8±0.9%, t2.14=18.60, p=0.0021) and WASH1 (WT 100.0±4.3%, MUT 1.1±0.4%, t2.1=22.77, p=0.0018) were significantly decreased. Equivalent amounts of protein were analyzed in each condition (β-tubulin: WT 100.0±8.2%, MUT 94.1±4.1%, U=4, p>0.99). (C) Schematic of experimental techniques used to interrogate the effect of the SWIPP1019R mutation in subsequent figures: spatial proteomics (top), confocal and electron microscopy (middle), and mouse behavioral tasks (bottom).


