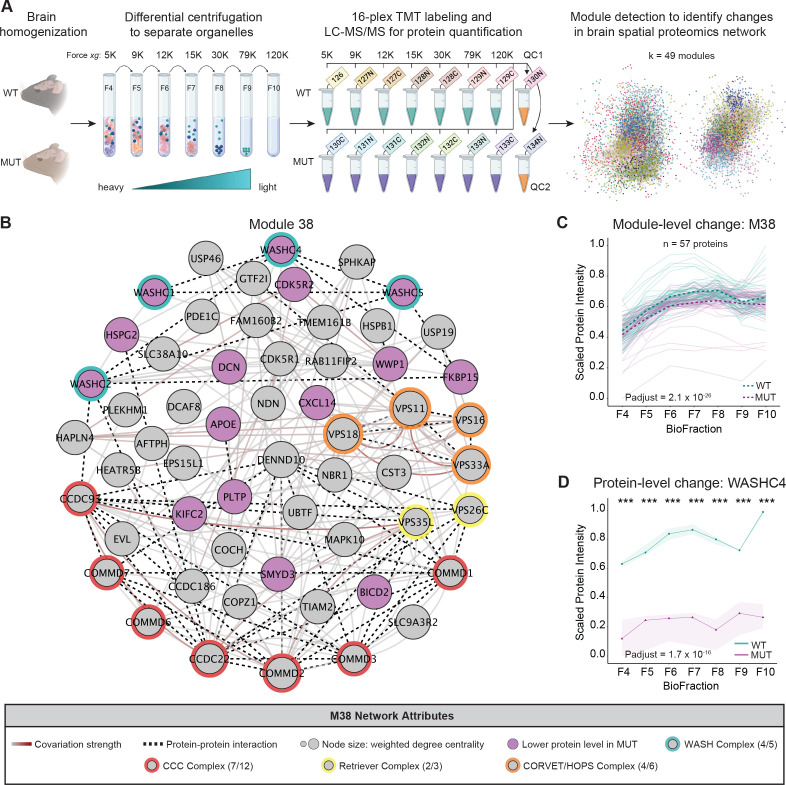
Figure 3. Spatial proteomics and network covariation analysis reveal significant disruptions to the WASH complex and an endosomal module in SWIPP1019R mutant mouse brain.
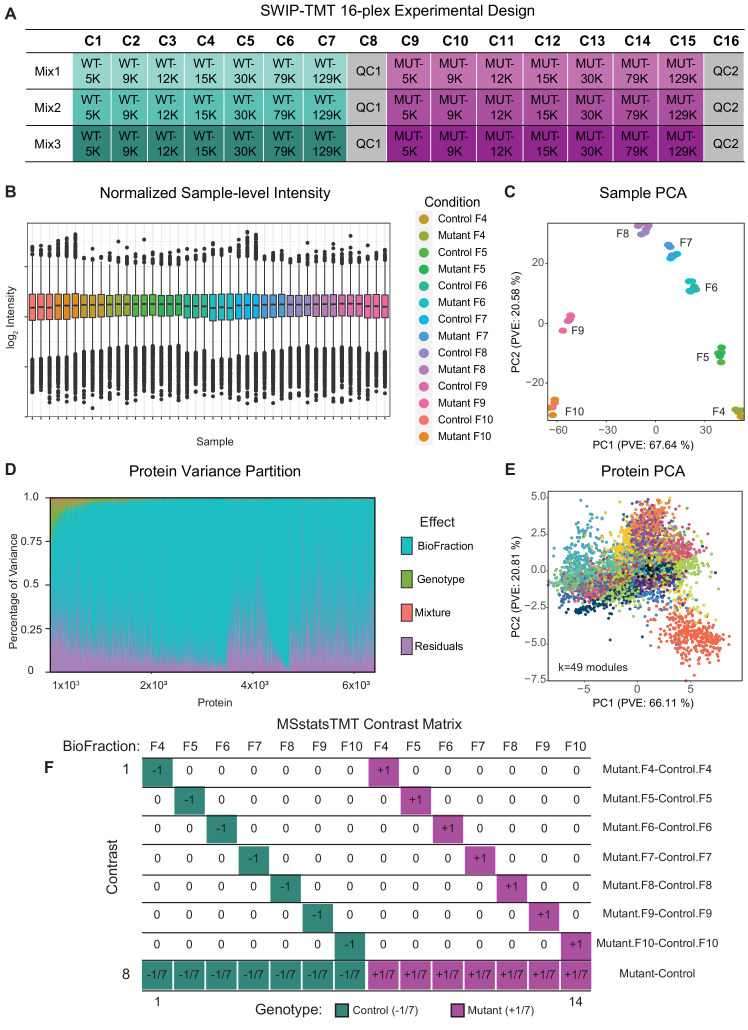
(A) Tandem-mass-tag (TMT) spatial proteomics experimental design. Seven subcellular fractions were prepared from one WT and one MUT mouse (10mo). These samples, as well as two pooled quality control (QC) samples, were labeled with unique TMT tags and concatenated for simultaneous 16-plex LC–MS/MS analysis. This experiment was repeated three times (three WT and three MUT brains total). To detect network-level changes, proteins were clustered into modules, and linear mixed models (LMMs) were used to identify differences in module abundance between WT and MUT conditions. The network shows an overview of the spatial proteomics graph in which 49 different modules are indicated by colored nodes. (B) Protein module 38 (M38) contains subunits of the WASH, CCC, Retriever, and CORVET/HOPS complexes. Node size denotes its weighted degree centrality (~importance in module); purple node color indicates proteins with altered abundance in MUT brain relative to WT; red, yellow, orange, and green node borders highlight protein components of the CCC, Retriever, CORVET/HOPS, and WASH complexes obtained from the CORUM database; dashed black edges indicate experimentally determined protein-protein interactions; and gray-red edges denote the relative strength of protein covariation within a module (gray=weak, dark red=strong). (C) M38 displays decreased overall abundance in MUT brain. The aligned profiles of all M38 proteins are plotted together after sum normalization, and rescaling such that the maximum intensity is 1. Each solid line represents a single protein, measured in WT (teal) and MUT (purple) conditions. The estimated WT and MUT means are displayed in dashed teal and purple lines, respectively (WT-MUT Contrast log2Fold-Change=−0.12, T=−11.14, DF=2324, p-adjust=2.078×10⁻²⁶; n=3 independent experiments). (D) Protein profile of WASHC4 (aka SWIP) plotted as relative (sum-normalized) protein intensity, rescaled to be in the range of 0–1 (WT-MUT Contrast log2Fold-Change=−1.517, DF=26, p-adjust=1.72×10⁻¹⁶; n=3 independent experiments). WT levels are depicted in teal, and MUT levels are depicted in purple. Shaded error bar represents the min-to-max values of all three experimental replicates. Significant differences in individual BioFraction WASHC4 levels are indicated with stars. ***p<0.001, MSstatsTMT p-value for intra-BioFraction comparisons with FDR correction.

