. 2021 Mar 22;10:e61590. doi: 10.7554/eLife.61590

Figure 6. SWIPP1019R mutant brains exhibit markers of abnormal endo-lysosomal structures and cell death in vivo.

(A,B) Representative images of adolescent (P42) WT and MUT motor cortex stained with cleaved caspase-3 (CC3, green). (C) Anatomical representation of mouse brain with motor cortex highlighted in red, adapted from the Allen Brain Atlas (Oh et al., 2014). (D,E) Representative image of adult (10 mo) WT and MUT motor cortex stained with CC3 (green). (F, G, I, and J) DAPI co-stained images for (A, B, D, and E, respectively). Scale bar for (A–J), 15 µm. (H) Graph depicting the normalized percentage of DAPI+ nuclei that are positive for CC3 per image. No difference is seen at P42, but the amount of CC3+ nuclei is significantly higher in aged MUT mice (P42 WT 6.97 ± 0.80%, P42 MUT 5.26 ± 0.90%, 10mo WT 25.38 ± 2.05%, 10mo MUT 44.01 ± 1.90%, H=74.12, p<0.0001). We observed no difference in number of nuclei per image between genotypes. (K) Representative transmission electron microscopy (TEM) image taken of soma from adult (7mo) WT motor cortex. Arrowheads delineate electron-dense lipofuscin material, Nuc=nucleus. (L) Representative transmission electron microscopy (TEM) image taken of soma from adult (7mo) MUT motor cortex. (M) Inset from (K) highlights lysosomal structure in WT soma. Pseudo-colored region depicts lipofuscin area, demarcated as L. (N) Inset from (L) highlights large lipofuscin deposit in MUT soma (L, pseudo-colored region) with electron-dense and electron-lucent lipid-like (asterisk) components. (O) Graph of areas of electron-dense regions of interest (ROI) shows increased ROI size in MUT neurons (WT 2.4×10⁵ ± 2.8×10⁴ nm2, n=50 ROIs; MUT 8.2×10⁵±9.7×10⁴ nm2, n=75 ROIs; U=636, p<0.0001). (P) Graph of the average number of presumptive lysosomes with associated electron-dense material reveals increased number in MUT samples (WT 3.14±0.72 ROIs, n=14 images; MUT 10.86 ± 1.42 ROIs, n=14 images; U=17, p<0.0001). For (O) and (P), images were taken from multiple TEM grids, prepared from n=3 animals per genotype. Scale bar for all TEM images, 1 µm. Data reported as mean ± SEM, error bars are SEM. *p<0.05, ****p<0.0001, Kruskal–Wallis test (H), Mann–Whitney U test (O,P).

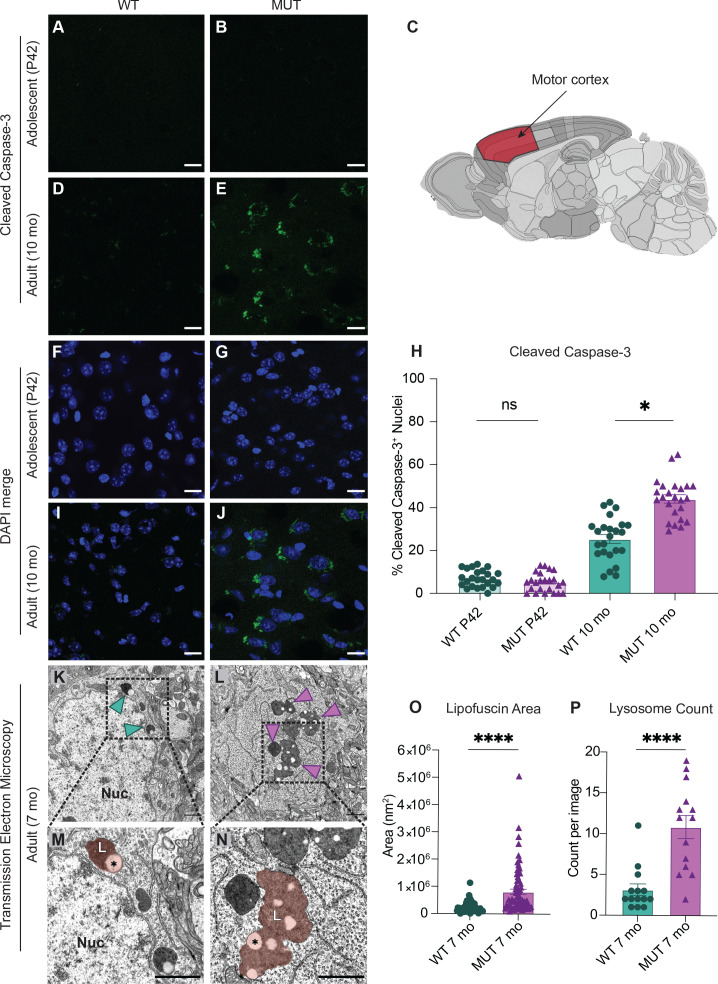
Figure 6.

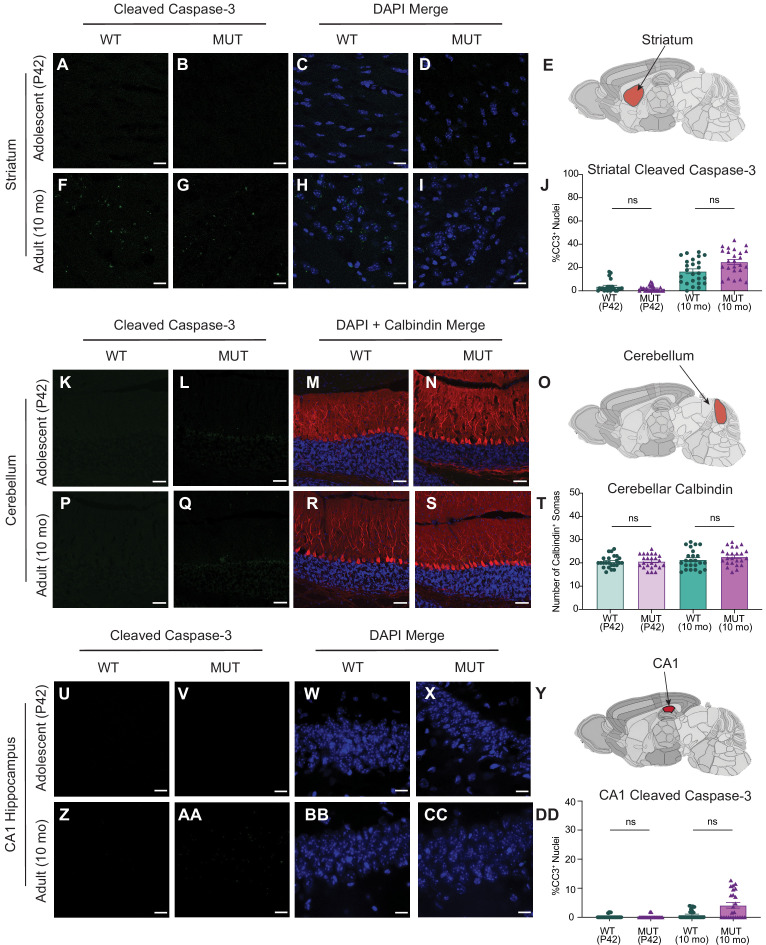
Figure 6—figure supplement 1. There is no significant difference in striatal, cerebellar, or hippocampal cell death between WT and MUT mice.

Figure 6—figure supplement 1.

(A) Representative image of adolescent (P42) WT striatum stained with cleaved caspase-3 (CC3, green). (B) Representative image of adolescent (P42) MUT striatum stained with cleaved caspase-3 (CC3, green). (C,D) DAPI co-stained images of A and B, respectively. (E) Anatomical representation of mouse brain with striatum highlighted in red, adapted from the Allen Brain Atlas (Oh et al., 2014). (F) Representative image of adult (10 mo) WT striatum stained with CC3 (green). (G) Representative image of adult (10 mo) MUT striatum stained with CC3 (green). (H,I) DAPI co-stained images of F and G, respectively. Scale bars for A-I are 15 µm. (J) Graph depicting the normalized % of DAPI+ nuclei that are positive for CC3 per image. No difference is seen between genotypes at either age (P42 WT 3.70 ± 0.99%, P42 MUT 1.95 ± 0.49%, 10mo WT 16.77 ± 2.09%, 10mo MUT 24.86 ± 2.17%, H=61.87, p<0.0001). (K) Representative image of adolescent (P42) WT cerebellum stained with cleaved caspase-3 (CC3, green). (L) Representative image of adolescent (P42) MUT cerebellum stained with cleaved caspase-3 (CC3, green). (M,N) DAPI and Calbindin co-stained images of K and L, respectively. (O) Anatomical representation of mouse cerebellum, adapted from the Allen Brain Atlas (Oh et al., 2014). Red region highlights area used for imaging. (P) Representative image of adult (10 mo) WT cerebellum stained with CC3 (green). (Q) Representative image of adult (10 mo) MUT cerebellum stained with CC3 (green). No significant CC3 staining is observed at either age. (R,S) DAPI and Calbindin co-stained images of P and Q, respectively. Scale bars for K-S are 50 µm. (T) Graph depicting the number of Calbindin+ somas per image, a marker for Purkinje cells. No difference is seen between genotypes at either age (P42 WT 20.50 ± 0.53, P42 MUT 20.67 ± 0.59, 10mo WT 21.42 ± 0.85, 10mo MUT 22.63 ± 0.74, H=4.891, p=0.1799). (U) Representative image of adolescent (P42) WT hippocampus stained with cleaved caspase-3 (CC3, green). (V) Representative image of adolescent (P42) MUT hippocampus stained with cleaved caspase-3 (CC3, green). (W,X) DAPI co-stained images of U and V, respectively. (Y) Anatomical representation of mouse hippocampus CA1, adapted from the Allen Brain Atlas (Oh et al., 2014). Red region highlights area used for imaging. (Z) Representative image of adult (10 mo) WT hippocampus stained with cleaved caspase-3 (CC3, green). (AA) Representative image of adult (10 mo) MUT hippocampus stained with cleaved caspase-3 (CC3, green). (BB and CC) DAPI co-stained images of Z and AA, respectively. (DD) Graph of the normalized % of DAPI+ nuclei that are positive for CC3 per image. Very little CC3 staining is seen at either age, regardless of genotype (P42 WT 0.21±0.11%, P42 MUT 0.15±0.11%, 10mo WT 0.81±0.28%, 10mo MUT 4.13±0.96%, H=20.27, p=0.0001). Data obtained from four animals per condition and reported as mean ± standard error of the mean (SEM), with error bars as SEM. Kruskal–Wallis test (JT, and DD).
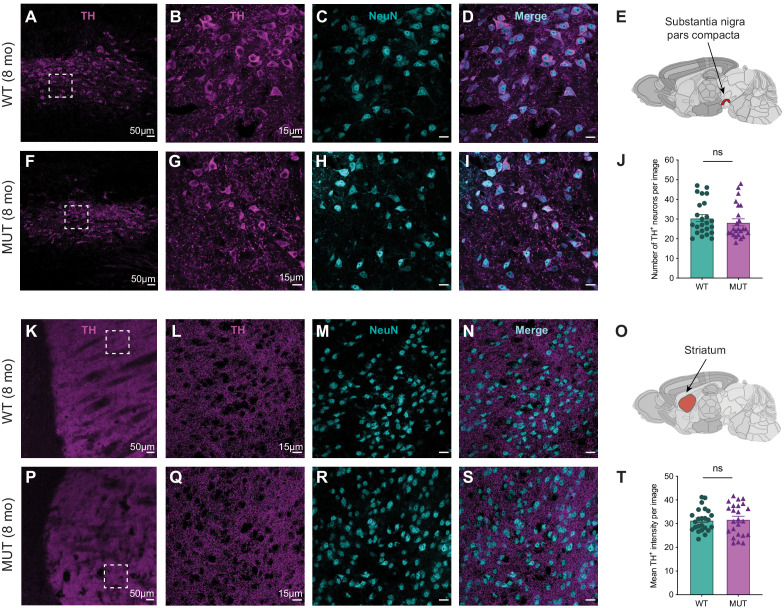
Figure 6—figure supplement 2. Dopaminergic innervation is not significantly different between aged WT and MUT mice.

Figure 6—figure supplement 2.

(A) Representative 10x image of tyrosine hydroxylase (TH) staining in the substantia nigra pars compacta (SNpc) of an 8-month-old WT mouse. Scale bar is 50 µm. (B–D) Representative 40x image of WT SNpc, depicting tyrosine hydroxylase+ (TH+) dopaminergic cell bodies (B), NeuN+ neuronal marker (C), and their merged image (D). Scale bars are 15 µm. (E) Schematic representation of brain region analyzed, substantia nigra pars compacta, adapted from Allen Brain Atlas (Oh et al., 2014). (F) Representative 10x image of TH staining in the substantia nigra pars compacta (SNpc) of an 8-month-old MUT mouse. Scale bar is 50 µm. (G–I) Representative 40x image of MUT SNpc, depicting tyrosine hydroxylase+ (TH+) dopaminergic cell bodies (G), NeuN+ neuronal marker (H), and their merged image (I). Scale bars are 15 µm. (J) Graph depicting the mean number of TH+ neurons per 40x image reveals no difference between WT and MUT SNpc (8mo WT 30.5±1.78 cells, n=24 images, 8mo MUT 28.33 ± 1.77 cells, n=24 images; U=234, p=0.2695). (K) Representative 10x image of TH staining in the striatum of an 8-month-old WT mouse. Scale bar is 50 µm. (L–N) Representative 40x image of WT striatum depicting TH+ dopaminergic innervation (L), NeuN+ neuronal marker (M), and their merged image (N). Scale bars are 15 µm. (O) Schematic representation of brain region analyzed, striatum, adapted from Allen Brain Atlas (Oh et al., 2014). (P) Representative 10x image of TH staining in the striatum of an 8-month-old MUT mouse. Scale bar is 50 µm. (Q–S) Representative 40x image of MUT striatum depicting tyrosine hydroxylase+ (TH+) dopaminergic innervation (Q), NeuN+ neuronal marker (R), and their merged image (S). Scale bars are 15 µm. (T) Graph depicting the mean intensity of TH+ signal per 40x image reveals no significant difference between WT and MUT dopaminergic innervation (8mo WT 31.48 ± 0.97, n=24 images, 8mo MUT 31.80 ± 1.35, n=24 images; t41.82=0.1955, p=0.8459). Data obtained from three animals per condition and reported as mean ± standard error of the mean (SEM), with error bars as SEM. Mann–Whitney test (J) and two-tailed t-test (T).