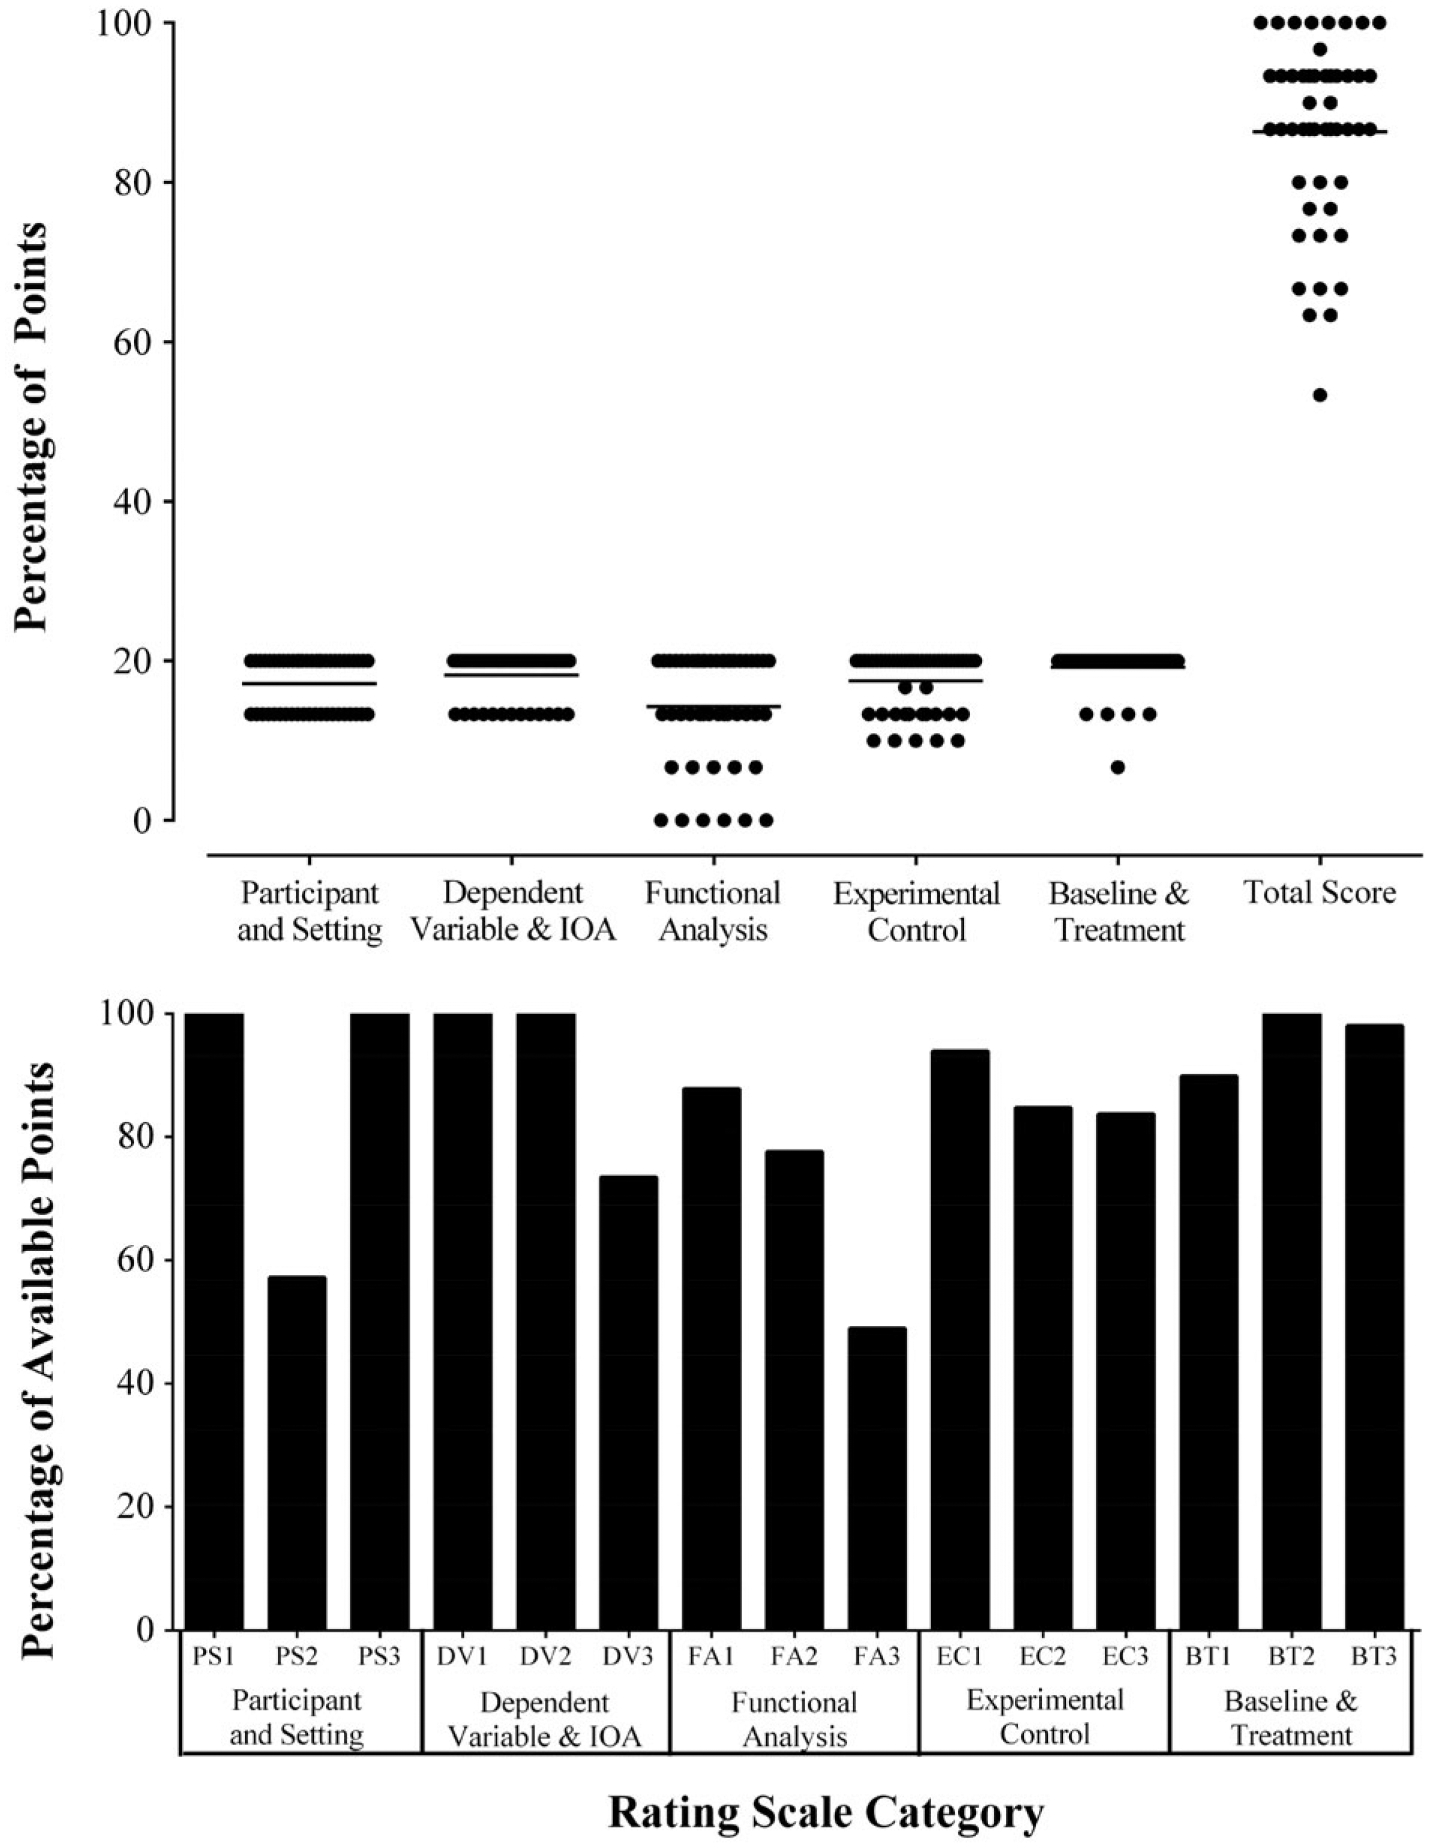
Figure 1.

Results of the Research Article Rating Scale (RARS) analysis.. The top panel shows the percentage of points obtained in each subscale and total percentage of pointsfor each article. The bottom panel shows the percentage of available points obtained across all articles for each question on the RARS. See the RARS for the specific questions in each subscale.
