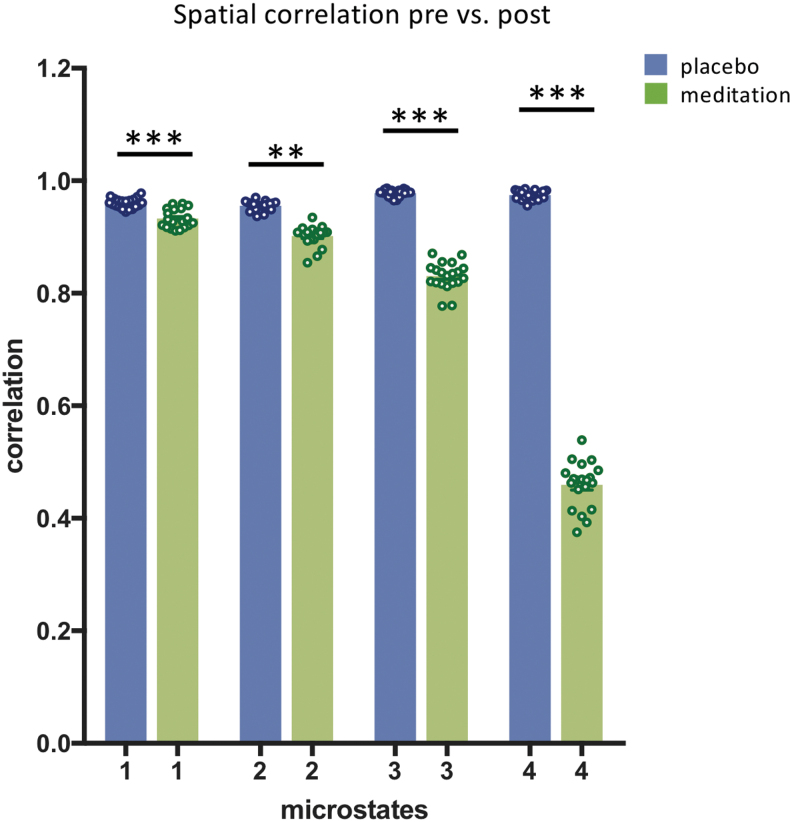
FIG. 2.
Mean spatial correlation of the four microstate maps between pre- and postplacebo and pre- and postmeditation. The means and standard errors were obtained by correlating the mean maps of each participant in one condition with the mean maps of all participants in the other condition and averaging the correlation values after z-transformation. **p < 0.001; ***p < 0.0001. Color images are available online.

