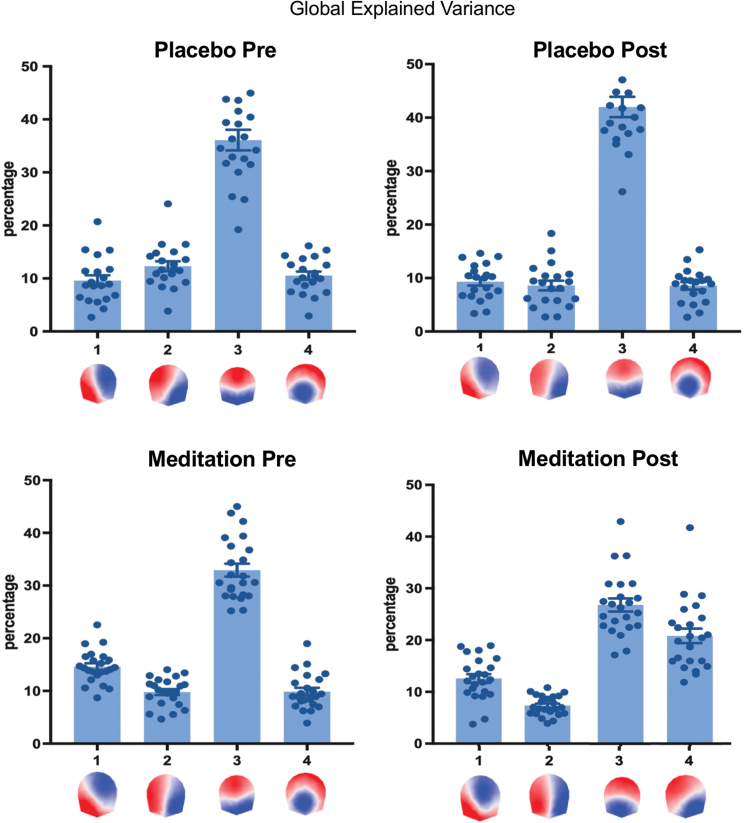
FIG. 3.
GEV of each of the four EEG microstate maps in the four experimental conditions (pre- and postplacebo and pre- and postmeditation). The four microstates together explained around 70% of the data in each of the four conditions (preplacebo: 68.5%, postplacebo: 68.5%, premeditation: 67.2%, and postmeditation: 67.6%). EEG, electroencephalography; GEV, global explained variance. Color images are available online.

