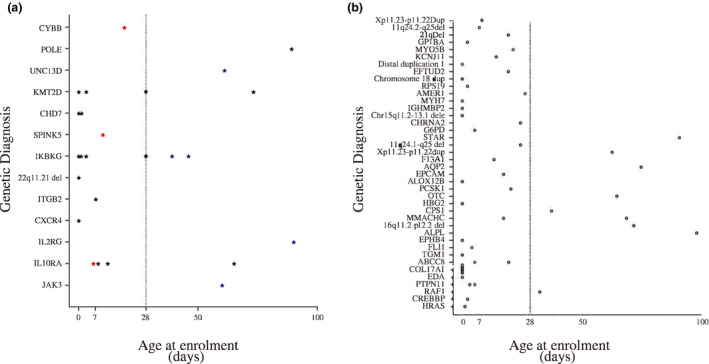
Figure 3.

Age at disease onset for 25 PID patients vs 47 non‐PID patients. (a) Age at disease onset of 25 PID patients and (b) age at disease onset of 47 non‐PID patients. Circles represent non‐PID cases, and stars represent PID cases. Red presents death before 28 DOL, and blue represents death between 28 and 100 DOL. Solid line presents the boundary before 28 DOL and after. DOL, days of life; PID, primary immunodeficiency.
