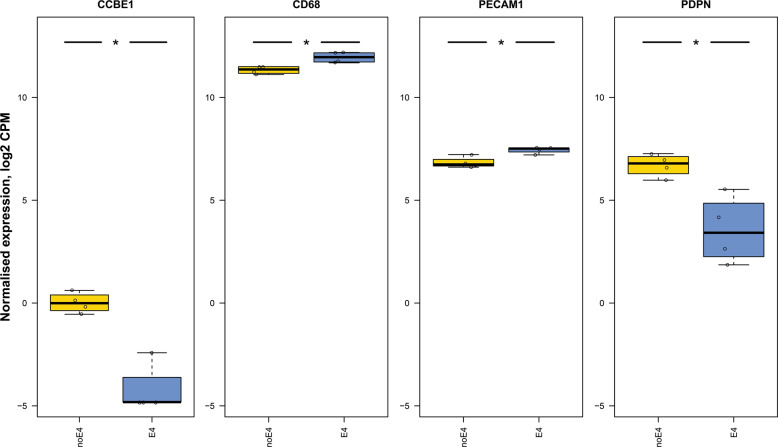
Fig. 2. Box and whisker plots showing meningeal lymphatic marker expression levels in iPSC-derived APOE4 and APOE3 (control) knock-in cells, with iPSCs being derived from an unaffected subject carrying APOE3 alleles, in which cells were gene edited using CRISPR/Cas9 to generate APOE4 iPSCs from parental APOE3 cells, and isogenic iPSCs were then differentiated into neurons, astrocytes, and microglia-like cells.
Normalized gene expression of meningeal lymphatic markers and related genes in cells expressing knock-in of either non-APOE4 (blue) or APOE4 (yellow). Differentially expressed genes are marked with an asterisk to indicate statistical significance: asterisk (*) for false discovery rate (FDR) ≤ 0.05; double asterisks (**) for FDR ≤ 0.01; and triple asterisks (***) for FDR ≤ 0.001. The perpendicular bars represent the standard deviation (SD). Based on reanalysis of data from the published source in [163]. Please note that the scale of the graph may differ between the different depicted genes.

