Fig. 1.
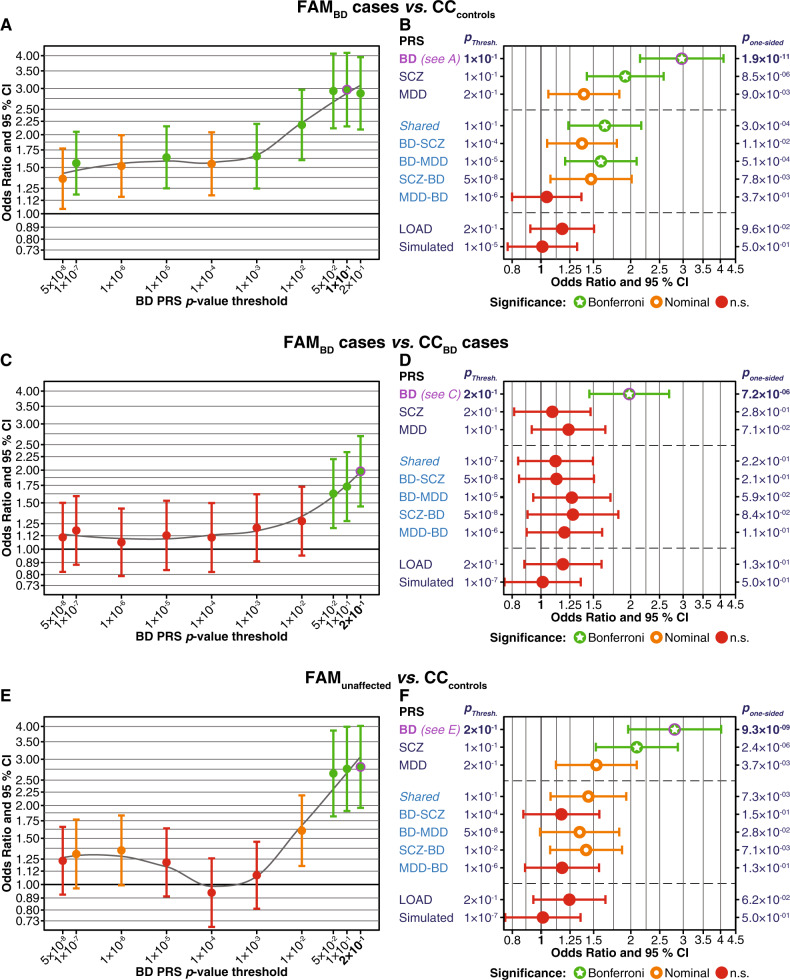
Comparison of PRS between FAM and CC samples. Married-in family members were excluded from these analyses. The plots show one-sided p-values, following the hypothesis that family members have higher PRS than individuals from the CC samples. All PRS have been normalised using Z-score standardisation. a, b Comparison of FAMBD cases to CCcontrols. a FAMBD cases had higher BD PRS across all ten pPRS thresholds. The plot shows odds ratios (OR, y-axis, filled circles) and 95% confidence intervals (CI); pPRS thresholds are shown on the x-axis. Results for each threshold are coloured by their degree of significance (one-sided p-values): red = not significant, orange = nominally significant, green = significant after Bonferroni correction for multiple testing (α = 0.05/60 = 0.00083). The top-associated PRS (pPRS = 0.1) is indicated in bold font and was marked by a magenta circle (also in b). b For ten different PRS, this plot shows association statistics for the top-associated pPRS thresholds. The x-axis shows ORs. BD, SCZ, MDD: Standard PRS using the respective PGC GWAS summary statistics. Shared: Shared psychiatric PRS (SNPs with BD, MDD, SCZ p < 0.05, random-effects meta-analysis). BD-SCZ, BD-MDD: BD-specific GWIS PRS corrected for SCZ and MDD, respectively. SCZ-BD and MDD-BD: GWIS PRS for SCZ and MDD, each corrected for BD. LOAD: PRS for late-onset Alzheimer’s disease. Simulated: Mean and CI of the 10,000 simulated PRS at the pPRS with the lowest mean association p-value of all simulated PRS. The column to the left of the plot: pPRS with the strongest association. Supplementary Fig. S2 shows plots for all pPRS. Column to the right: pone-sided = one-sided p-value. For full association test statistics, see Supplementary Table S3. Bonferroni = significant after Bonferroni correction for multiple testing; nominal = nominally significant (p < 0.05); n.s. = not significant. c, d Comparison of FAMBD cases and unrelated CCBD cases. See Supplementary Fig. S3 and Table S4 for more detailed plots and full association test statistics. e, f Comparison of FAMunaffected and CCcontrols. See Supplementary Fig. S4 and Table S5 for more detailed plots and full association test statistics

