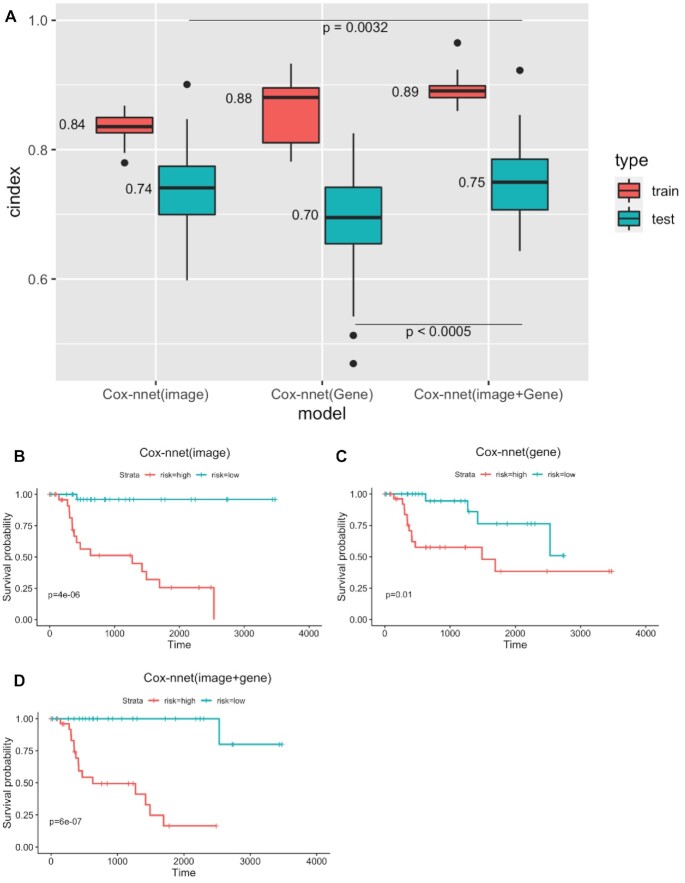
Figure 4.
Comparison of Cox-nnet prognosis prediction using pathology imaging, gene expression and the combination of the two data types. (A) C-index results on training and testing datasets. (B–D) Kaplan–Meier survival curves on testing datasets. (B) Cox-nnet model on imaging data only. (C) Cox-nnet model on gene expression data only. (D) two-stage Cox-nnet model combining imaging and gene expression data.

