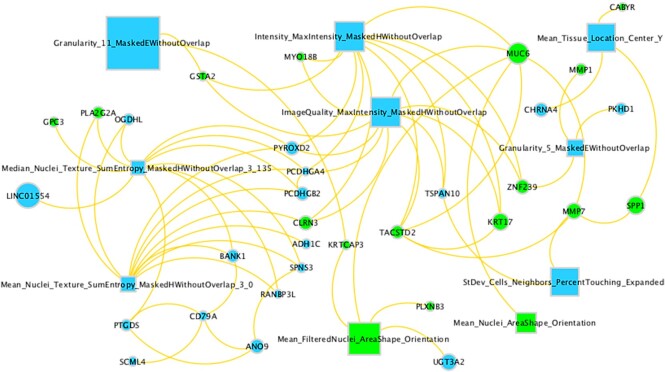
Figure 6.
Relationship between top imaging and gene features. Rectangle nodes are image features and circle nodes are gene features. Node sizes are proportional to importance scores from Cox-nnet. Two gene nodes are connected only if their correlation is > 0.5; an image node and a gene node are connected only if their correlation is > 0.1 (P-value < 0.05). Green nodes represent features with positive coefficients (hazard ratio) in univariate Cox-PH regression, indicating worse prognosis. Blue nodes represent features with negative coefficients (hazard ratio) in univariate Cox-PH regression, indicating protection against bad prognosis.

