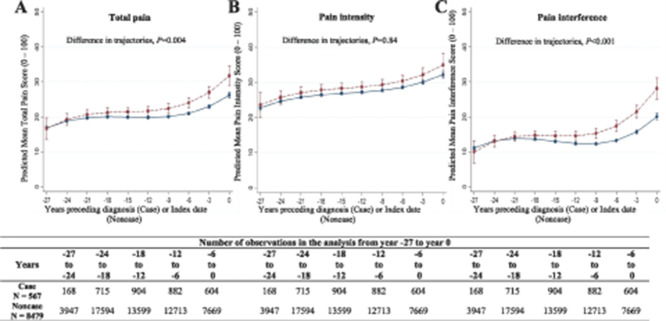
Figure 1.
Twenty-seven–year trajectories of pain, using continuous measures, before dementia diagnosis.  Noncase;
  case. Estimated from linear mixed models adjusted for age at year 0, sex, education, ethnicity, marital status, dementia status, slope terms (time, time2, and time3), interaction of these covariates with slope terms, birth cohort, pain medication use, multimorbidity index, and depression assessed at the time of pain measurement. Estimates came from Margins command in STATA. Higher scores correspond to higher pain.

