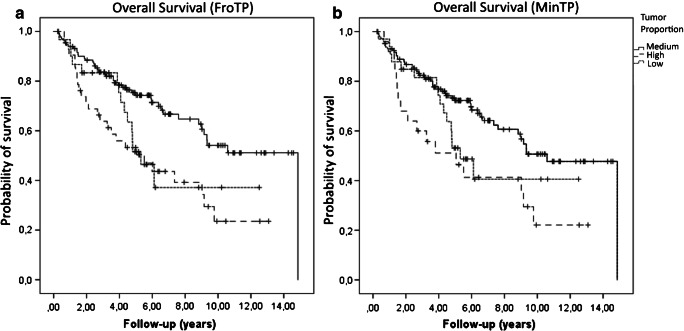
Fig. 3.
a Kaplan-Meier curves for the overall survival based on the overall patient population and the tumor proportion in the front region (FroTP) (high versus medium tumor proportion p = 0.001; low versus medium tumor proportion p = 0.03). b Kaplan-Meier curves for the overall survival based on the overall patient population and the tumor proportion in the region with the lowest estimated tumor proportion (MinTP) (high versus medium tumor proportion p = 0.006; low versus medium tumor proportion p = 0.094)

