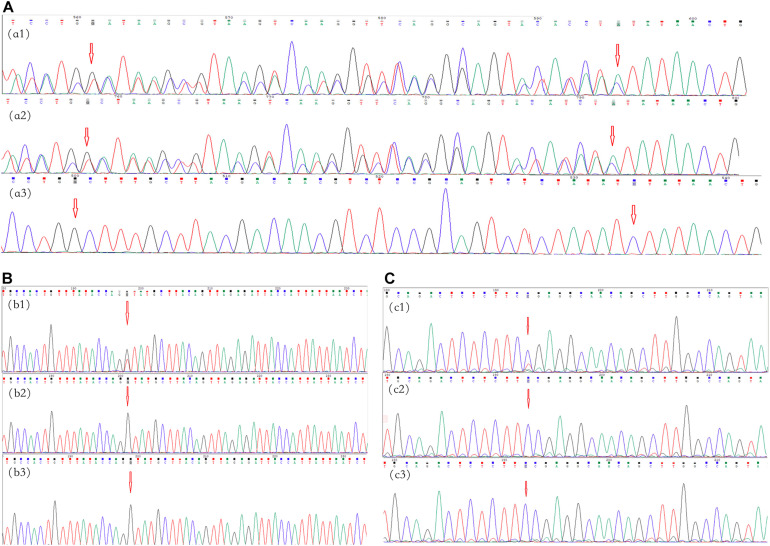
FIGURE 2.
Mutational analysis of the neurofibromatosis (NF) patients in families 1–3. The red arrows indicate the mutation sites. (A) Family 1: the c.5072_5073insTATAACTGTAACTCCTGGGTCAGGGAGTACACCAA:p.Tyr1692Ilefs frameshift variant in NF1 in exon 37 in proband III-1 (a1) and her father (a2); there was no mutation in her mother (a3). (B) Family 2: the c.4110 + 1G > T splicing variant in NF1 at the first base downstream of the 3′-end of exon 30 in proband II-1 (b1); there were no mutations in her father and mother (b2,b3, respectively). (C) Family 3: the c.3826C > T:p.Arg1276Ter missense variant in NF1 in exon 28 in proband II-1 (c1); there were no mutations in his father and mother (c1,c2, respectively).

