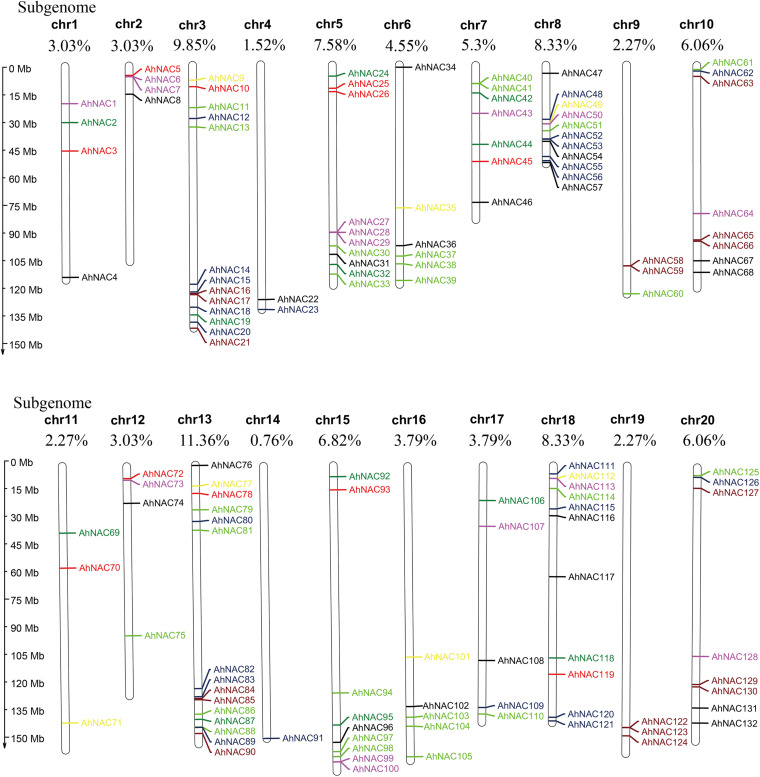
FIGURE 2.
Chromosomal physical map showing the uneven distribution of AhNAC genes on each chromosome. Different colors indicate the different subgroups. The chromosome length is shown to the left of the map, and the serial numbers of chromosomes (chr1–chr20) and the distribution frequencies are shown on the top of each chromosome. Black represents group I, red represents group II, green represents group III, blue–black represents group IV, yellow represents group V, purple represents group VI, light green represents group VII, and brown represents group VIII.

