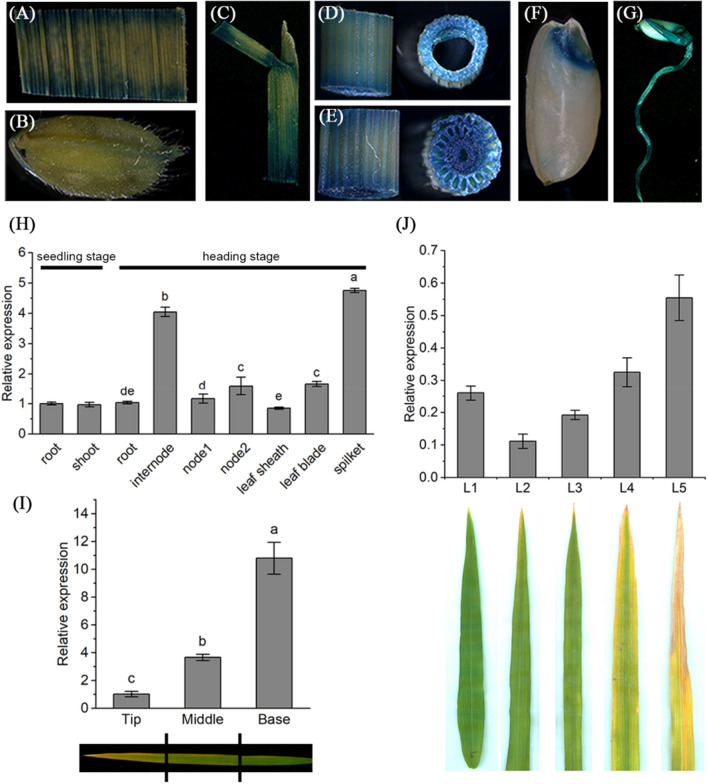
Fig. 5.
Expression pattern of YL3. a–g. Histochemical GUS staining of leaf (a), spikelet (b), leaf sheath (c), internode (d), node (e), embryo (f), coleoptile and radicle (g); h Expression levels of YL3 in various organs at the seedling and heading stages (means ± SD, n = 3). At the seedling stage, Student’s t test was performed; at the heading stage, different lowercase letters above the bars indicate a statistical difference at P ≤ 0.05 by one-way ANOVA and Duncan’s test; i Expression levels of YL3 in senescent leaves of WT (means ± SD, n = 3); j Expression of YL3 at different growth stages. L1, flag leaf; L2, top second leaf; L3, top third leaf; L4, top fourth leaf; L5, top fifth leaf. Different lowercase letters above the bars indicate a statistical difference at P ≤ 0.05 by one-way ANOVA and Duncan’s test

