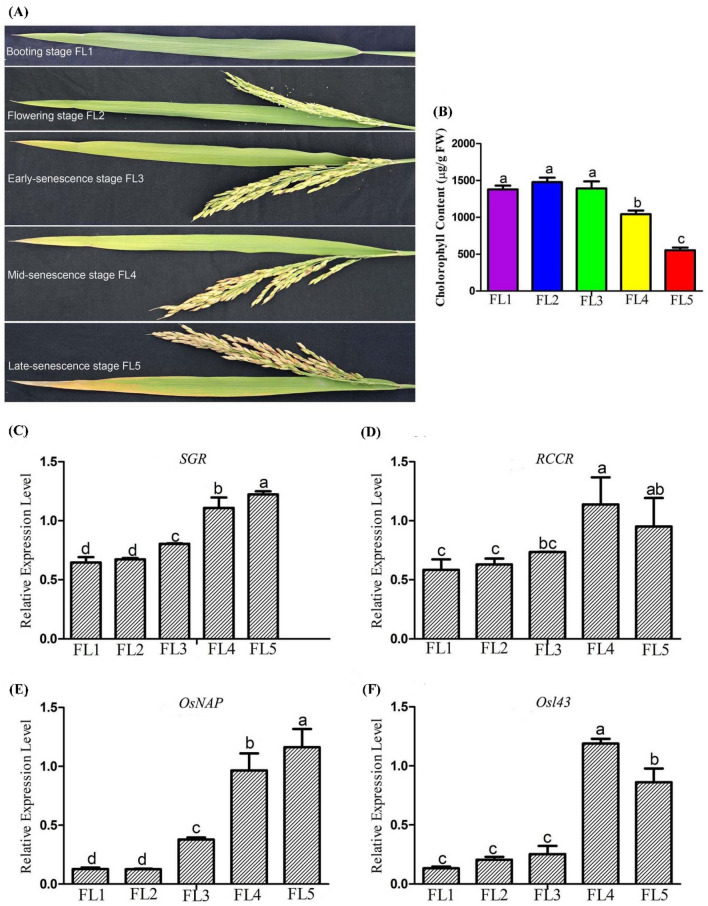
Fig. 1.
The senescence feature of rice flag leaves sampled at five developmental stages. a The sampled flag leaves at booting stage (FL1), flowering stage (FL2), early-senescence stage (FL3), mid-senescence stage (FL4) and late-senescence stage (FL5), respectively. b The measured chlorophyll content of rice flag leaf. c, d The expression trends of two chlorophyll degradation-associated genes (SGR, LOC_Os09g36200; RCCR1, LOC_Os10g25030). e, f The expression trends of two senescence-associated genes (OsNAP, LOC_Os03g21060; Osl43, LOC_Os01g24710). The data are expressed as the mean ± SD of three biological replicates. Different letters indicate values are statistically different based on one-way ANOVA analysis

