Figure 2.
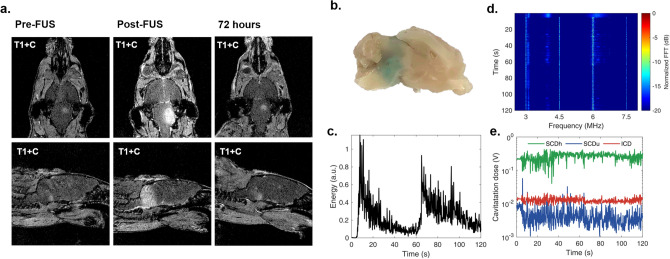
BBB opening and recorded acoustic emissions with passive cavitation measurements. (a) T1-weighted MR imaging showing sonication of tumor and peritumoral region. BBB closure demonstrated at 72 h after FUS. (b) Evans blue staining demonstrates BBB disruption on gross histology. (c) In vivo passive cavitation detection measurements confirmed that stable cavitation dominated throughout ultrasound treatment. Acoustic energy emitted by the microbubbles was higher in the beginning of the treatment, and gradually decreased due to microbubble clearance from the vasculature. (d) Spectrogram of the entire treatment session. Higher harmonic emissions were detected, with no substantial increase in the broadband floor after microbubble entrance into the focal volume. (e) Stable harmonic cavitation levels rose slightly after microbubble administration at 0 and 60 s and remained relatively constant throughout the sonication. Stable ultraharmonic (blue line) and inertial cavitation levels (red line) showed an absence of violent cavitation events. FFT = fast Fourier transform.

