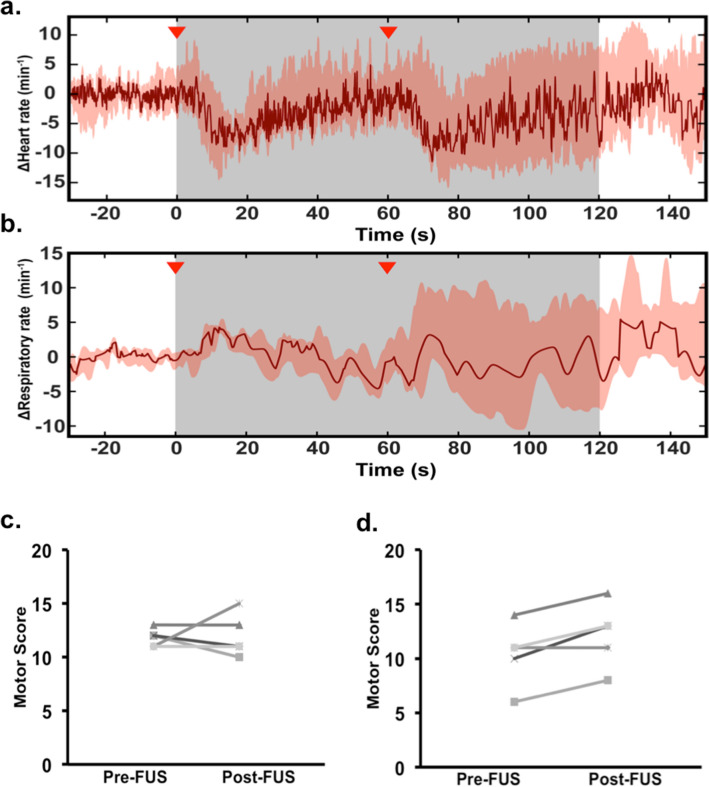
Figure 3.
Monitoring of cardiopulmonary vitals and motor testing. (a) The grey region indicates the period of sonication. Mean change in pulse across all mice showed injection-associated (red arrows) physiological dip in heart rate that spontaneously resolves. No cardiac pause or apnea was observed. (b) Mean respiratory rate recording showed no significant fluctuations or change. Shaded areas represent one standard deviation. (c) Weights test in FUS group revealed no difference in motor score before and after FUS (p = 0.8470). (d) After the second FUS, mice did show a significant trend with improved motor testing (p = 0.0301).

