Figure 5.

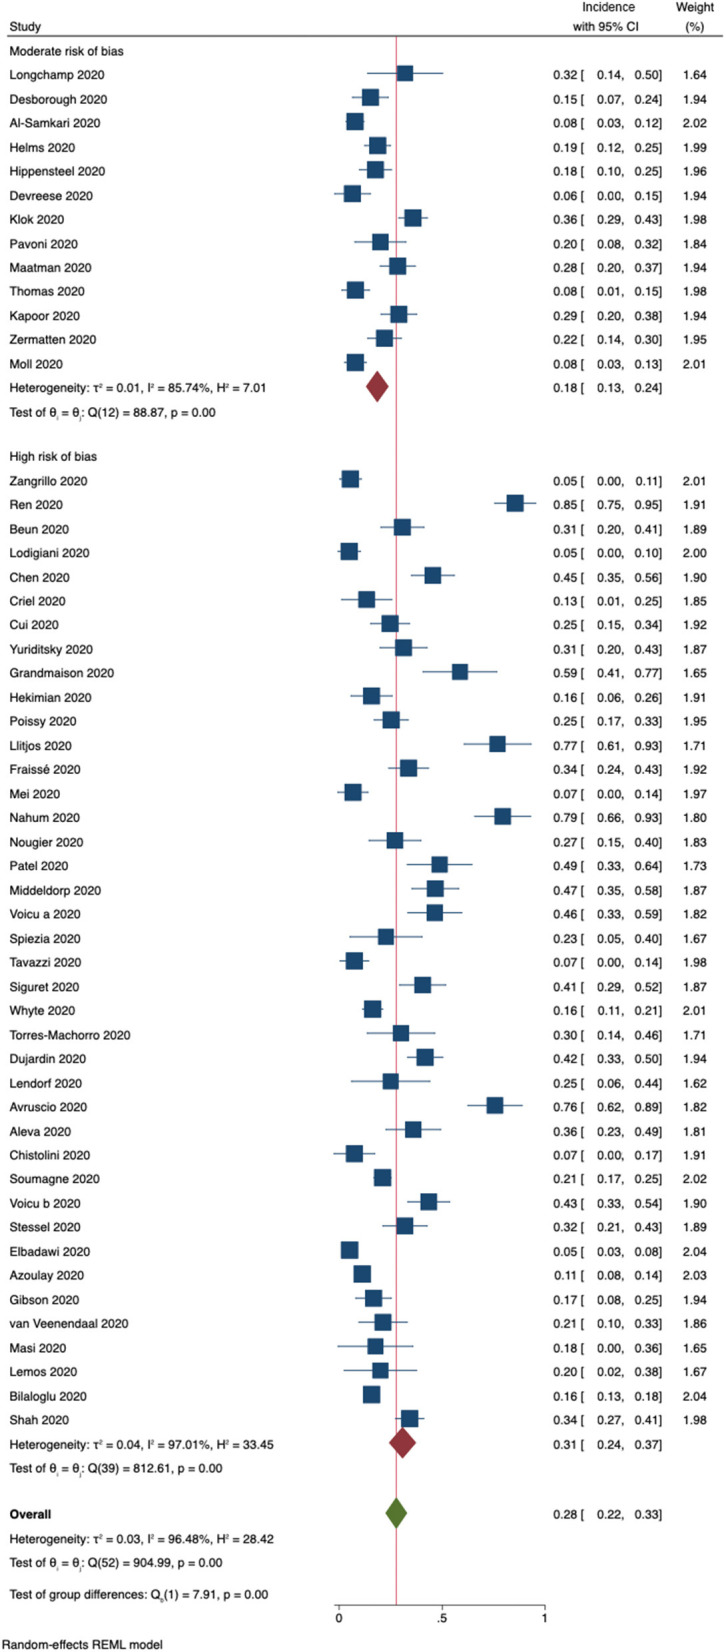
Incidence of the composite outcome VTE (DVT + PE) for 53 included studies. Forest plot shows subgroups according to risk of bias.

Incidence of the composite outcome VTE (DVT + PE) for 53 included studies. Forest plot shows subgroups according to risk of bias.