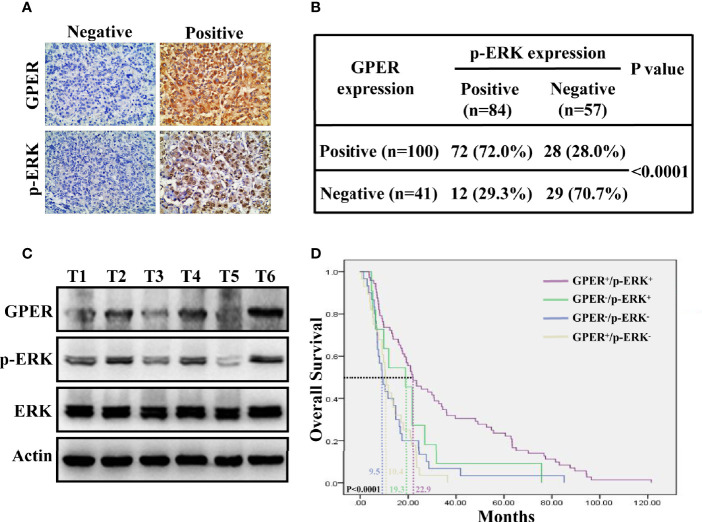
Figure 5.
Co-expression of GPER and p-ERK predicts improved prognosis for HCC patients. (A) Representative GPER and p-ERK staining in 141 HCC specimens. GPER was detected in the cytoplasm, while p-ERK was mostly expressed in the nucleus (400× magnification, scale bar = 50 μm). (B) Significantly different IHC staining of p-ERK in GPER-positive tissue compared with that in GPER-negative tissue (P < 0.0001). (C) Western blot of GPER and p-ERK proteins in six frozen HCC tissue samples (T1–T6). (D) Kaplan–Meier plots for OS vs. GPER/p-ERK status. Patients with HCC and high GPER/ERK activation are predicted to have better outcomes than those with other subtypes. The median OS times of GPER-/p-ERK-, GPER+/p-ERK-, GPER-/p-ERK+ and GPER+/p-ERK+ patients were 9.5, 10.4, 19.3 and 22.9 months, respectively (P < 0.0001).

