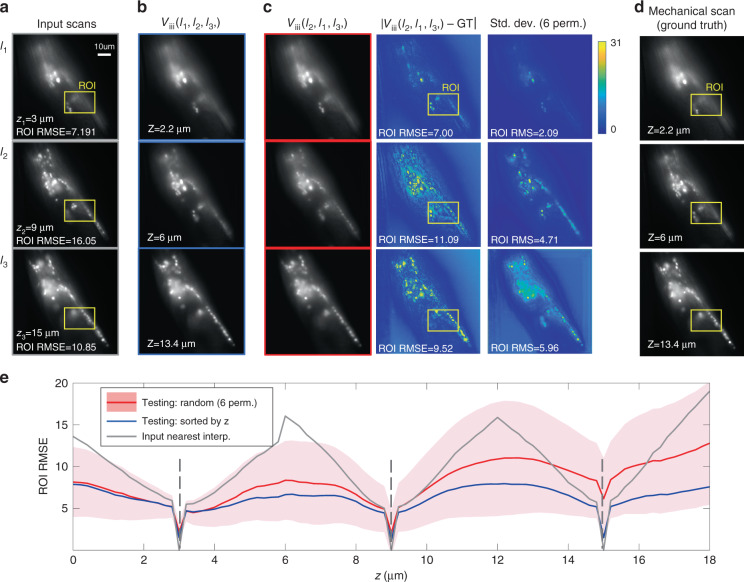
Fig. 6. Permutation invariance of Recurrent-MZ to the input images.
Recurrent-MZ was trained with inputs (M = 3) sorted by z and tested on new samples with both inputs sorted by z as well as 6 random permutations of the same inputs to test its permutation invariance. a The input images sorted by z, and the RMSE values between the ground truth image and the corresponding nearest input image are shown. b The Recurrent-MZ outputs of the input sequence (I1, I2, I3), c the test outputs with input sequence (I2, I1, I3), the corresponding difference maps and the pixel-wise standard deviation over all the 6 random permutations, d the ground truth images obtained by mechanical scanning through the same sample, acquired with an axial spacing of 0.2 μm, e red solid line: the average RMSE of the outputs of randomly permuted input images; pink shadow: the standard deviation RMSE of the outputs of randomly permuted input images; blue solid line: the RMSE of the output of input images sorted by z; gray solid line: the RMSE value of the nearest interpolation using the input images, calculated with respect to the ground truth images. Gray dashed lines (vertical) indicate the axial positions of input images. RMSE and RMS values were calculated based on the yellow highlighted ROIs. The range of grayscale images is 255, while that of the standard variance images is 31

