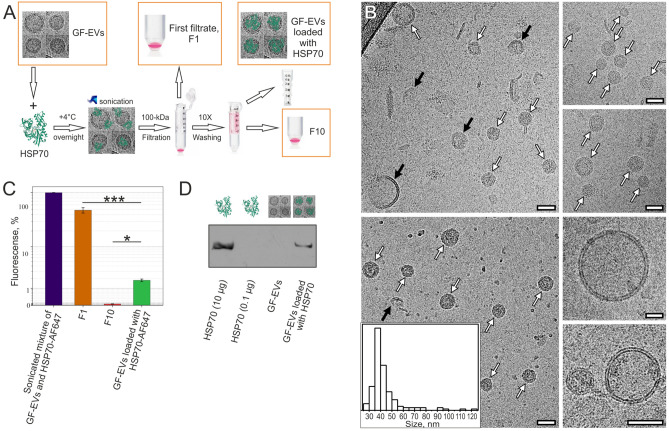
Figure 4.
Loading efficiency of GF-EVs with HSP70 protein. (A) Flowchart summarizing the procedure of GF-EV loading with HSP70. (B) Cryo-EM images of GF-EVs loaded with HSP70. White arrows indicate vesicles with intact membrane, black arrows indicate vesicles with broken membrane. Scale bars are 50 nm. Inset—size distribution histogram. A total of 157 particles was analyzed. (C) Fluorescence of Alexa Flour 647 labeled HSP70 in the initial mixture and loaded samples of GF-EVs, as well as washing filtrates F1 and F10. N = 3. Data are presented as means ± standard deviation (SD). *, p < 0.05; ***, p < 0.001 as estimated by one-way ANOVA followed by multiple comparisons Tukey’s post-hoc analysis. (D) Western blot of HSP70 in the initial and loaded samples of GF-EVs. The full-length blot image used to generate panel is shown in Supplementary Fig. S2.

