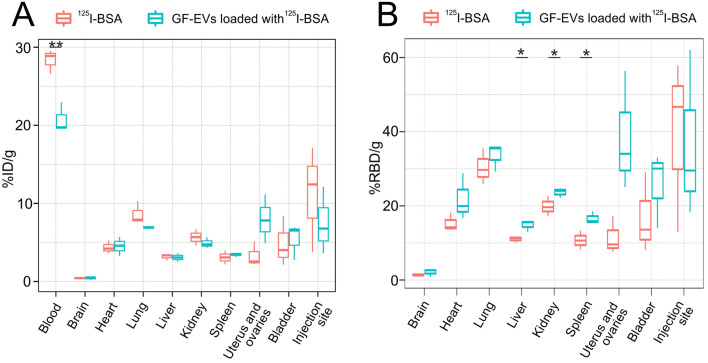
Figure 7.
Biodistribution of GF-EVs loaded with 125I-labeled BSA and free 125I-BSA in mice 2 h after intravenous administration. Analysis of the radioactive protein abundance in different tissues expressed as a percentage of injected dose (ID) per gram of tissue (A) or as a percentage of relative blood dose (RBD) per gram of tissue (B). N = 3. Data are presented as means ± SD. *, p < 0.05; **, p < 0.01 as estimated by unpaired Student’s t-test analysis.

