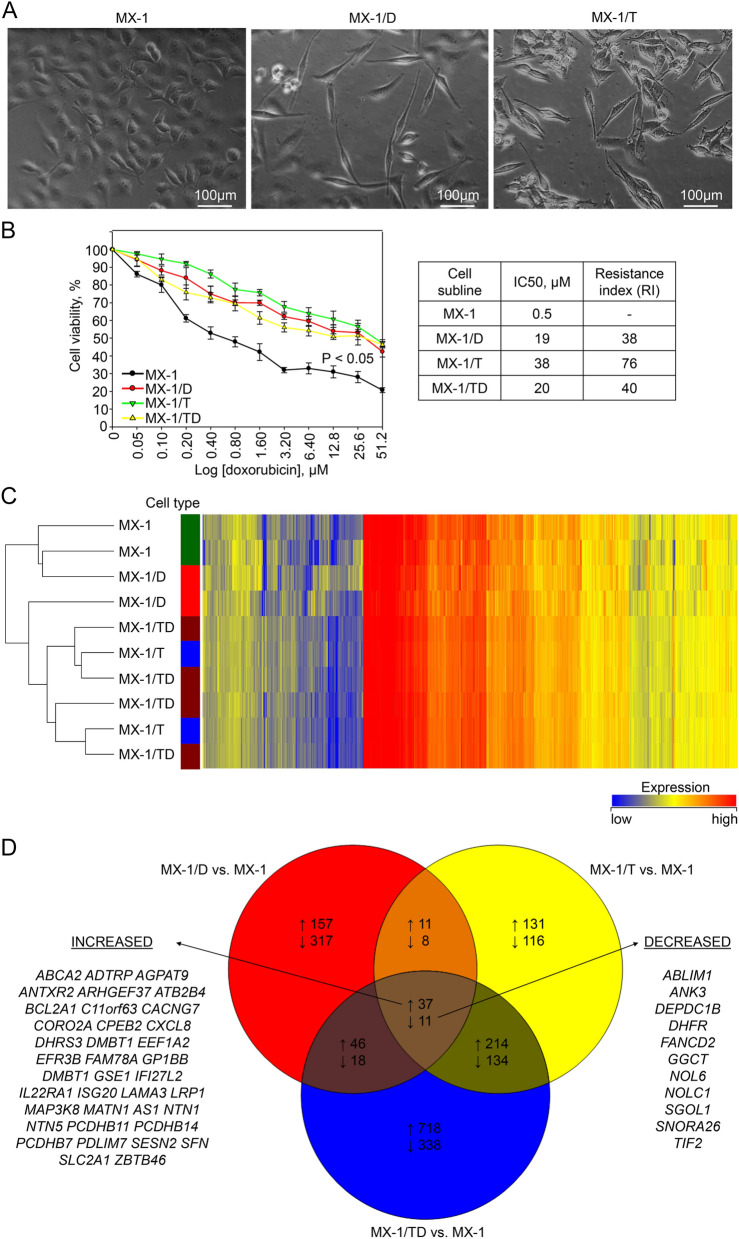
Figure 1.
Characterization of chemoresistant MX-1 cell sublines. (A) Representative phase-contrast microscopic images demonstrating morphology of MX-1 cells and morphological changes in MX-1/D and MX-1/T cells cultured in media with doxorubicin and TPP+ respectively. Magnification—× 200. (B) Cytotoxicity of doxorubicin measurements with the MTT assay in the parental MX-1 cells and chemoresistant MX-1/D (cultured with 80 nM of doxorubicin), MX-1/T (cultured with ABCB1 transporter activator TPP+ (128 nM)) and MX-1/TD (MX-1/T cells cultured in media supplemented with up to 1280 nM of doxorubicin for a week). The indicated P-value was calculated at the end point of the experiment, compared the viability of each chemoresistant cell sublines with wild-type cells. Resistance index was calculated IC50 values of chemoresistant cells dividing by IC50 of parental MX-1 cells. (C) Heatmap showing the gene expression profile of the parental MX-1 and chemoresistant MX-1/D, MX-1/T and MX-1/TD cells. The results were obtained by Human Gene Expression (v2) 8 × 60 K microarrays (design ID 039494). (D) Venn diagram, showing the numbers of overlapping deregulated genes among MX-1/D, MX-1/T and MX-1/TD sublines compared to untreated MX-1 cells. Listed genes are common in the all investigated cells.

